ONLINE INQUIRY
QualiCell® Human Kupffer Cells
Cat.No.: CSC-C9039J
Species: Human
Source: Liver
Cell Type: Kupffer Cell
- Specification
- Background
- Scientific Data
- Q & A
- Customer Review
Human Kupffer cells (KCs) were described and named by Karl Wilhelm von Kupffer in 1876, are specialized macrophages that reside in the liver as part of the mononuclear phagocyte system. They make up 30-35% of nonparenchymal liver cells and 80-90% of all macrophages in the human body. Usually, they're found in the lumens of liver sinusoids and adhere to the endothelium. KCs come from their own macrophage lineage, and they aren't stem cells from hematopoietic stem cells but from the yolk sac. Kupffer cells have the ability to regenerate themselves (an average of 3-4 days) under the control of apoptosis. They can migrate to portal areas and liver lymph nodes before they are phagocytosed by adjacent KCs. KCs are amoeboid with oval or oblong nuclei. There are microvilli, pseudopodia and lamellipodia stretching from their cell surface outwards. Morphologically, KCs are amoeboid, with nuclei that are oval or indented. Their cell surfaces are equipped with microvilli, pseudopodia, and lamellipodia extending in various directions. These structures are involved in phagocytosis and pinocytosis, clearing foreign debris and particles such as pathogens, immune complexes, liposomes, lipid microspheres, tumor cells, endotoxins, and various other particulates.
Along with their phagocytosis, KCs also secrete inflammatory cytokines, reactive oxygen species, TNF-α and proteases. In liver infection or injury, the KCs-induced inflammatory response prevents infection and repairs damage to the host. But in some liver disorders like NAFLD/NASH, KC activation promotes liver inflammation that is out of control. Therefore, it's essential to find strategies to reduce or suppress, but not abolish, KC activity in the liver in order to treat chronic inflammatory liver disorders.
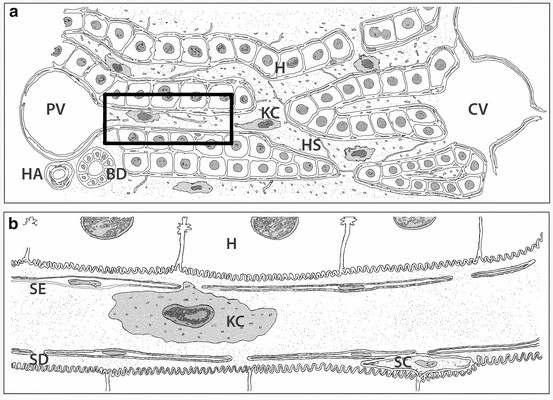 Fig. 1. Schematic representation of the liver micro-anatomical structure and Kupffer cells localization in lower (a) and higher magnification (b) (Woltman AM., Boonstra A., 2014).
HoxLDL-Stimulated Kupffer Cells Demonstrate Reduced Phagocytic Capacity, Increased Neutrophil Recruitment and NETosis Induction
The liver is the central organ for cholesterol synthesis and homeostasis, with studies indicating that oxidized low-density lipoprotein (OxLDL) plays a significant role in hepatic inflammation. But the precise mechanisms remain unclear. Maretti-Mira et al. found that the oxidation state of LDL influences gene transcription in liver M2-like macrophages, including genes involved in cholesterol metabolism, oxidative stress response, and innate inflammation. Additionally, both M2-like macrophages and Kupffer cells (KCs) undergo M4-like polarization. Hepatic macrophage populations are dynamic, with the M1 phenotype being a major source of pro-inflammatory cytokines and chemokines, the M2 phenotype contributing to inflammation resolution and wound healing, and the M4 phenotype exhibiting reduced phagocytic capacity and increased cholesterol efflux. This study provides a link between LDL oxidation and altered peripheral and hepatic macrophage function.
Phagocytosis is a key function of macrophages. The phagocytic capacity of Kupffer cells stimulated with native LDL (nLDL) or high OxLDL was assessed (Fig. 1A and B). The results showed that at 1 hour and 10 minutes, human KCs treated with high OxLDL exhibited a significant 60% reduction in phagocytic capacity compared to unstimulated KCs. Compared to nLDL treatment, high OxLDL significantly decreased phagocytosis by 39% at 2 hours. The inhibition of phagocytosis by high OxLDL was maintained for the entire duration of the study. In contrast, the phagocytic capacities of unstimulated and nLDL-stimulated KCs were comparable. Additionally, cytokine and chemokine secretion are another hallmark function of macrophages. Consequently, the neutrophil chemotactic activity of treated KCs was also assessed. Conditioned media from high OxLDL-treated KCs (KC-Hox) significantly recruited more neutrophils than media from PBS- or nLDL-stimulated KCs. The differences were significant at 8 hours, peaking at 12 hours. No significant difference was observed between KC-PBS and KC-nLDL recruitment (Fig. 2A). The effects on neutrophil extracellular trap formation (NETosis) revealed that KC-Hox triggered NET formation at 20 minutes, achieving a maximum effect at 1 hour and 10 minutes, and lasting for almost 2 hours (Fig. 2B and C). KC-PBS and KC-nLDL showed much lower NET formation induction and comparable results. These findings suggest that Kupffer cells exposed to HoxLDL transform into an M4-like phenotype and acquire new functionalities that may influence the progression of non-alcoholic fatty liver disease.
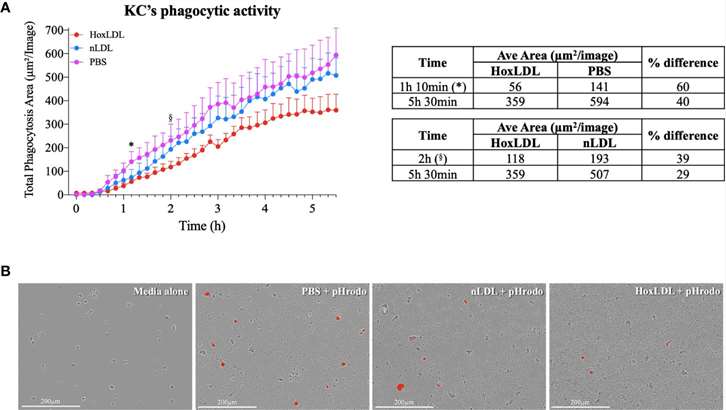 Fig. 1. HoxLDL inhibits human Kupffer cells' phagocytic activity (Maretti-Mira, A. C., Golden-Mason, L., et al., 2021).
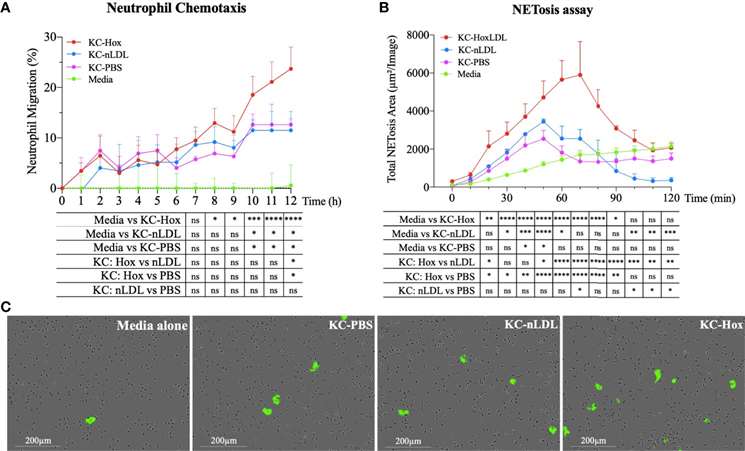 Fig. 2. HoxLDL-derived M4 polarization enhances neutrophil recruitment and NETosis (Maretti-Mira, A. C., Golden-Mason, L., et al., 2021).
The Variances in Cytokine Production Profiles from Non- or Activated THP-1, Kupffer Cell and Human Blood Derived Primary Macrophages Following Exposure to Either Alcohol or A Panel of Engineered Nanomaterials
The portfolio of cytokines is key to the function of macrophages as sentries of the innate immune system as well as being critical for the transition from innate to adaptive immunity. The changes in cytokine production levels (IL1-β, IL6, IL10 and TNF-α) as a consequence of nanomaterial (NM) and ethanol exposure was assessed in activated and non-activated THP-1 (immortalized monocyte-like cell line), primary human Kupffer cells and human primary peripheral blood mononuclear cells (PBMCs).
From the data, it is evident that the cytokine profile of the three macrophage models were markedly and significantly different from each other (Fig. 3 and 4). The data demonstrated that the PBMCs secreted the largest quantities of IL1-β, IL6 and TNF-α following NM or ethanol exposure (Fig. 3 and 4A-B). The same pattern was observed for both non-activated and activated macrophages. Overall, the data demonstrated only small variations in the individual cytokine responses between activated and non-activated macrophages exposed to the same xenobiotic. The control levels of cytokine expression in the non-activated models were expectedly lower as compared for the activated counterparts. As suspected, the IL10 secretion levels was highest for the KCs. However, small but significant levels of the anti-inflammatory IL10 cytokine were produced by the PMBC population following NM and ethanol treatment (Fig. 3C-D). The IL10 response was entirely absent from THP-1 (immortalized monocyte-like cell line) cells. In fact, generally speaking, the cytokine secretion for the THP-1 was relatively low, although statistically significant was reached for IL1β and TNF-α for the non- or activated THP-1 cells. Interestingly, no distinctly clear differences in the cytokine section patterns between the different NMs was apparent.
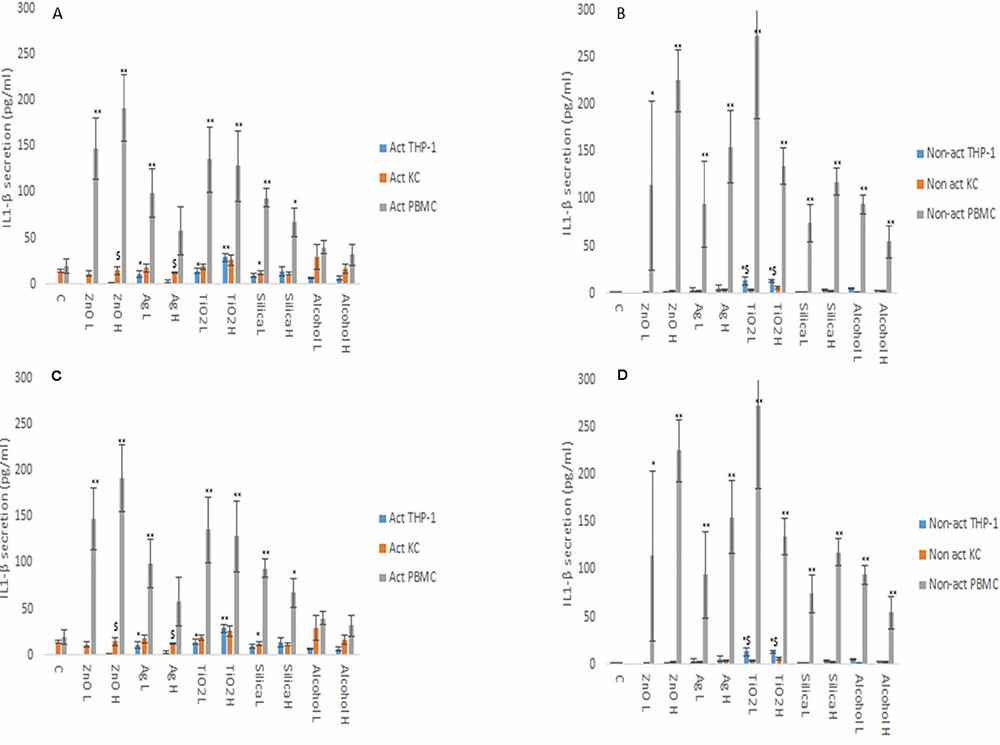 Fig. 3. IL1β (A and B) and IL6 (C and D) secretion from activated and non-activated THP-1, KC and PBMCs exposed to NMs or ethanol (Kermanizadeh, A., Brown, D. M., et al., 2019).
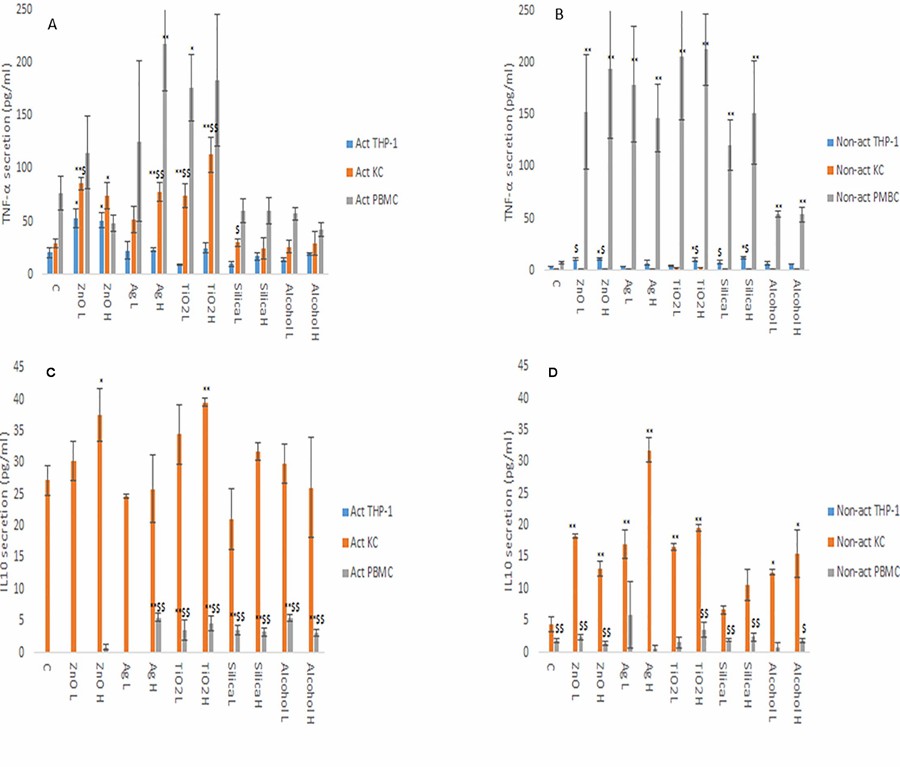 Fig. 4. TNF-α (A and B) and IL10 (C and D) secretion from activated and non-activated THP-1, KC and PBMCs exposed to NMs or ethanol (Kermanizadeh, A., Brown, D. M., et al., 2019).
Ask a Question
Write your own review
- You May Also Need

