ONLINE INQUIRY

Plateable hepatocytes from whole livers
Cat.No.: CSC-7664W
Species: Human
Source: Liver
Cell Type: Hepatocyte
- Specification
- Background
- Scientific Data
- Q & A
- Customer Review
Orders are delivered via Federal Express courier.
Must be processed immediately upon shipment receipt.
Media: Store at 2-8 °C
Cryopreserved cells: Liquid nitrogen
All Bioarray Inc products are for research use
Plateable hepatocytes from whole livers are derived from primary human liver cells and grown in a monolayer on culture plates, known as a plateable hepatocyte model. Such hepatocytes store many of the liver's physiological functions, such as, among others, the production of plasma proteins like albumin and prothrombin, lipid and hormone metabolism, bilirubin metabolism, and detoxification. The monolayer cell model consists of an extensive enzymatic apparatus and metabolic pathways, including the Cytochrome P450 system of enzymes (CYPs) and UDP-glucuronosyltransferases (UGTs), and serves as an effective tool for several in vitro experimental applications such as drug metabolism, liver hepatotoxicity, and disease simulation.
Creative Bioarray's optimized isolation and culture protocols ensure these plateable hepatocytes are viably and able to undergo prolonged in vitro growth and proliferation. During adherent growth, they acquire the same morphology as in vivo liver cells and can maintain normal proliferation and differentiation states under the right circumstances. This is an important feature for long term in vitro experiments, especially those that require 5-7 days of culture or longer. Furthermore, plateable hepatocytes are important for the creation of in vitro liver models. By using these cells, scientists can model an extreme replicable liver and use them to perform more elaborate physiological and pathological experiments. In short, plateable hepatocytes provide a rapid and effective in vitro model for drug metabolism, toxicology, and disease modeling that is widely used in biomedical research and new drug development.
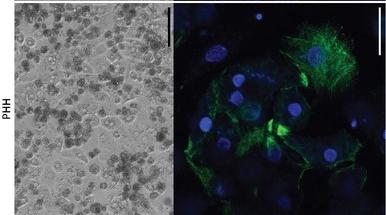 Fig. 1. Morphology of primary human hepatocytes (PHHs) (Bouwmeester, M. C., Tao, Y., et al., 2023).
N-acetyltransferase 2 mRNA, Protein Expression and Correlation Analysis of NAT2 in Cryoplateable Human Hepatocytes
Human arylamine N-acetyltransferases (NAT; EC 2.3.1.5) play crucial roles in drug and carcinogen metabolism through N- and O-acetylation. There are two isoforms, NAT1 and NAT2, both encoded by one gene on chromosome 8. Even though the sequences are more than 85 per cent identical, NAT1 and NAT2 differ in substrate specificity and tissue distribution. Variability in acetylation rates due to NAT2 polymorphisms has consequences for both drug efficacy and toxicity. Salazar-González et al. aimed to compare the performance of different antibodies for measuring NAT1 and NAT2 and to investigate the association between NAT2 genotype, NAT2 mRNA, protein expression, and catalytic activity in cryoplateable human hepatocytes.
There was no significant difference in mRNA between the rapid, intermediate and slow acetylator samples (Fig. 1a). Yet NAT2 protein expression was phenotypically different from the genotype to genotype, with intermediate and slow genotypes having approximately 40% and 60% lower protein levels, respectively, than rapid genotype (Fig. 1b and c). They also found striking differences between intermediate and slow genotypes (Fig. 1d). In particular, rapid acetylator NAT24/4 samples expressed significantly more protein than intermediate NAT24/5 and slow NAT25/5 and NAT26/6 genotypes.
A moderate correlation was found between the levels of NAT2 protein and SMZ N-acetyltransferase activity (Fig. 2a). The correlation coefficients for rapid, intermediate and slow NAT2 genotypes were 0.65, 0.023 and 0.0014 respectively. By contrast, there was a very low and insignificant relationship between NAT2 mRNA expression and SMZ N-acetyltransferase activity, and between NAT2 mRNA expression and protein expression (Fig. 2b and c).
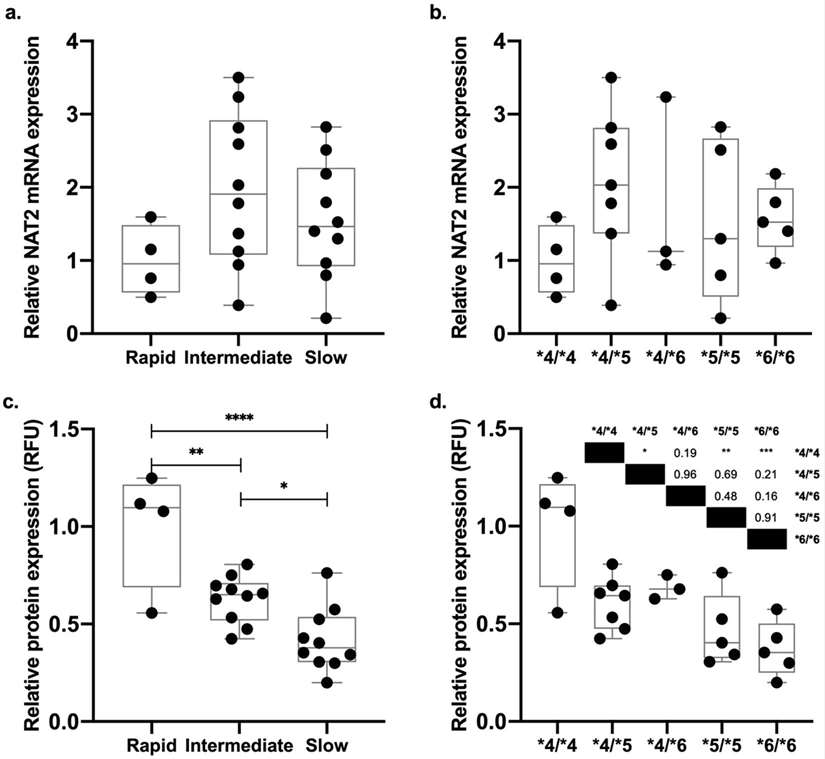 Fig. 1. NAT2 mRNA and protein expression in the cryoplateable human hepatocytes (Salazar-González R A., Doll M A., et al., 2020).
A moderate correlation was observed between the NAT2 protein expression and SMZ N-acetyltransferase activity (Fig. 2a). The correlation coefficients for rapid, intermediate, and slow NAT2 genotypes were 0.65, 0.023, and 0.0014, respectively. In contrast, there was a very slight and non-significant correlation between NAT2 mRNA expression and SMZ N-acetyltransferase activity, as well as between NAT2 mRNA expression and protein expression (Fig. 2b and c).
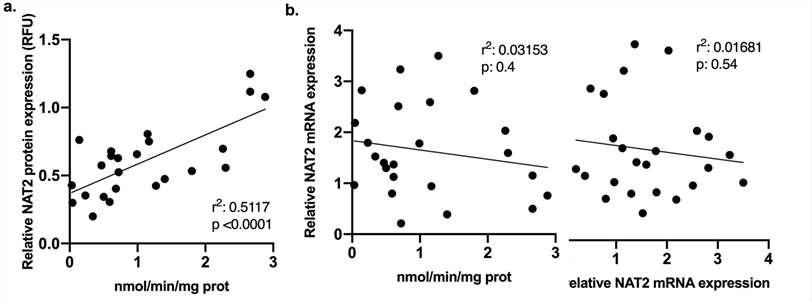 Fig. 2. N-acetylation activity and protein expression correlation in cryoplateable human hepatocytes (Salazar-González R A., Doll M A., et al., 2020).
Prediction of the Pharmacokinetics of Pravastatin as an OATP Substrate Using Plateable Human Hepatocytes with Human Plasma Data and PBPK Modeling
Active hepatic uptake, primarily mediated by organic anion-transporting polypeptides (OATPs), is crucial for drug disposition and clearance, as observed in statins like pravastatin. Traditional physiologically-based pharmacokinetic (PBPK) models often require scaling factors to translate in vitro data to in vivo predictions. Previous studies using various in vitro systems have shown inconsistencies, highlighting the need for a more accurate model. Mao et al. aimed to improve the translation of in vitro OATP transporter kinetic data to in vivo predictions by utilizing plateable human hepatocytes with human plasma.
Researchers tested a wide range of pravastatin concentrations (0.14-400 μM) in human hepatocytes with human plasma to obtain the full saturation kinetic curve. They used rifampicin (125 μM) to inhibit OATP uptake and measured intracellular pravastatin. Jmax and apparent Km for pravastatin were determined as 134.4 ± 14.3 pmol/min/million cells and 76.77 ± 27.4 μM, respectively. When integrating in vitro OATP transporter kinetic data into the PBPK model, the model accurately simulated the observed i.v. pharmacokinetic (PK) profile without scaling the kinetic data (Fig. 3a). The predicted PK profile matched well with the observed profile, especially in the third distribution phase. The predicted pravastatin AUC was within 1.5-fold of the observed in vivo PK data (Fig. 3b). In simulating oral PK for pravastatin, the clearance and volume of distribution from the i.v. model remained unchanged. Adjusting intrinsic transcellular permeability provided closer estimates to clinical data. The model effectively captured the oral PK profile for pravastatin doses from 0.0372 mg to 60 mg (Fig. 4a-e). Predictions of peak plasma concentration (Cmax) and AUC were close to observed values, but a trend of underprediction of Cmax was noted, suggesting further model refinement may be needed with more clinical data.
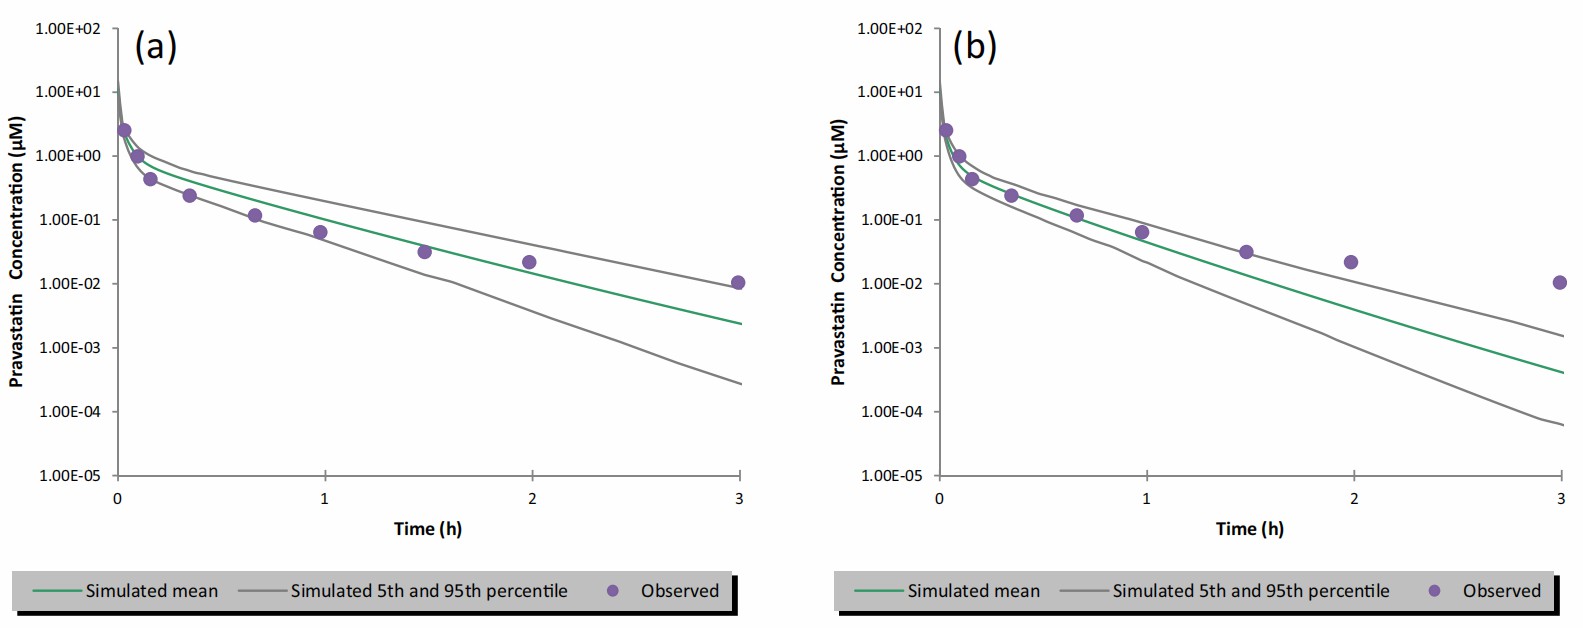 Fig. 3. Simulated vs. observed plasma concentration-time profiles of pravastatin after an i.v. bolus dose of 9.4 mg over 2 minutes (Mao J., Doshi U., et al., 2018).
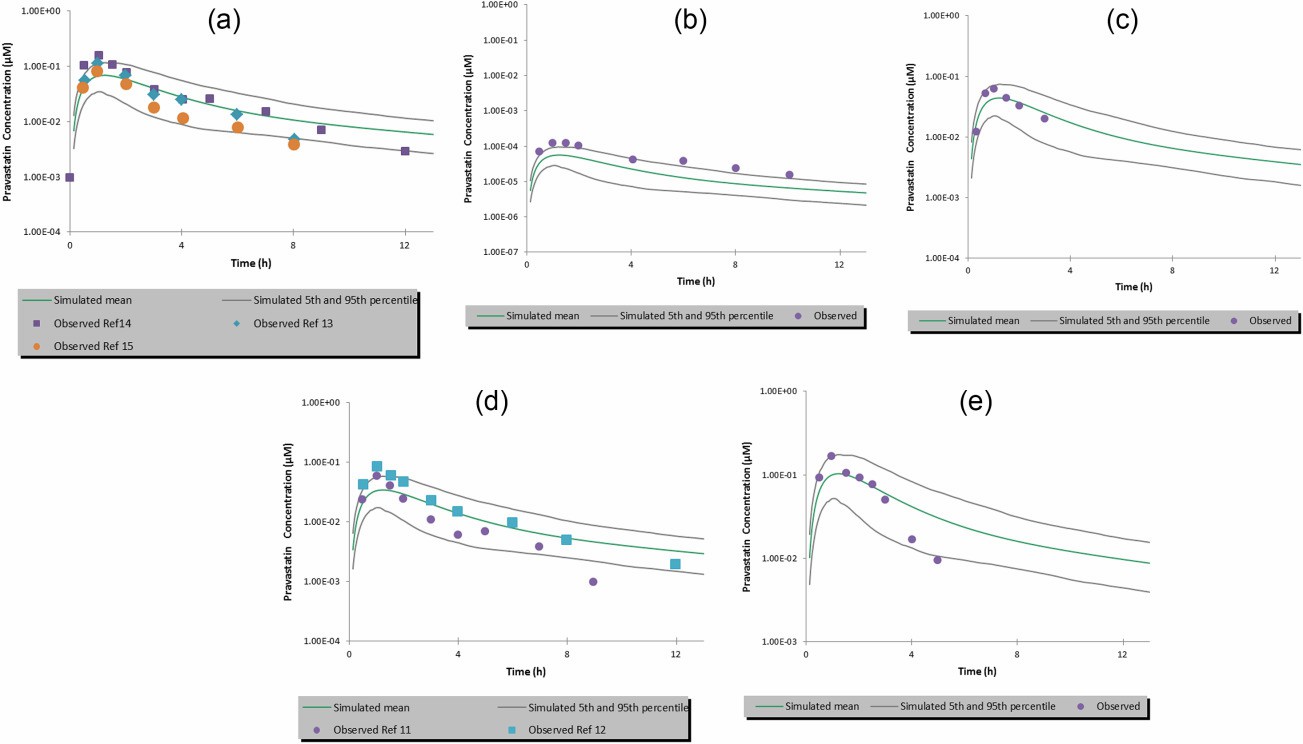 Fig. 4. Simulated vs. observed plasma concentration-time profiles of pravastatin after a single oral dose of (a) 40 mg; (b) 0.0372 mg; (c) 18.23 mg; (d) 20 mg, and (e) 60 mg (Mao J., Doshi U., et al., 2018).
Ask a Question
Write your own review

