Featured Products
Our Promise to You
Guaranteed product quality, expert customer support

ONLINE INQUIRY
EBC-1
Cat.No.: CSC-C6336J
Species: Human
Morphology: epithelial-like
Culture Properties: Adherent cells
- Specification
- Background
- Scientific Data
- Publications
- Q & A
- Customer Review
Store in liquid nitrogen.
The EBC-1 cell line is a human lung squamous cell carcinoma (SCC) cell line that serves as a significant tool for cancer research, particularly in the study of non-small cell lung cancer (NSCLC). Established from a patient with SCC, EBC-1 exhibits characteristic features of this aggressive cancer type, including distinct morphological traits and a specific genetic profile. The availability of this cell line allows researchers to investigate the biology of lung SCC, which is known for its poor prognosis and resistance to conventional therapies.
EBC-1 is particularly valuable for studying the molecular mechanisms underlying SCC progression and metastasis. The cell line retains key properties of the original tumor, including the expression of relevant biomarkers, which facilitates research into the pathways involved in tumor growth, invasion, and interaction with the tumor microenvironment. This makes EBC-1 an important model for understanding how SCC develops and responds to various treatments.
Researchers often utilize this cell line to screen potential chemotherapeutic agents and targeted therapies, providing insights into the effectiveness of various treatment strategies against lung SCC. Furthermore, EBC-1 can be employed to investigate mechanisms of drug resistance, which are critical for developing combination therapies that may improve patient outcomes.
Lung Cancer Cell Lines Depend on Met for Growth and Survival
Met, the receptor for hepatocyte growth factor, has been implicated in the growth, invasion, and metastasis of many tumors including NSCLC. Lentiviral vectors were used to deliver Met shRNA to EBC-1 and H1993 cells and found efficient knockdown of Met protein 72 h after infection (Fig. 1A). Protein knockdown as early as 24 h after virus removal (Fig. 2B). The Met shRNA M3 was highly efficient in decreasing Met protein (Fig. 1A), with M1 and M2 having less effect. A time course of growth inhibition with the potent Met shRNA M3 in H1993 and EBC-1 cells revealed that treated EBC-1 cells sustained a loss of ∼50% of the starting cell number within 48 to 72 h of virus removal (Fig. 1C, EBC-1). Although Met knockdown in H1993 cells did not result in a decrease in starting cell numbers, there was still no significant increase in cell number from the time of virus removal (Fig. 1B, H1993). To test for specificity of growth inhibition by Met shRNA, the remaining cell lines were treated in our panel with the M3 shRNA, and each of the three Met shRNAs was tested for growth inhibition in EBC-1, H1993, and A549 cells. Met shRNA treatment resulted in growth inhibition in EBC-1 and H1993 cells that corresponded to the amount of protein knockdown in Fig. 1A. Proliferation in A549 and the remaining cell lines was not inhibited by Met shRNA treatment (Fig. 1C), despite efficient knockdown of Met (Fig. 1D). Although H1048 and Calu-1 showed minor growth inhibition, the cell numbers in these lines increased 4-fold when treated with M3 shRNA, which is in contrast to the potent inhibition seen in H1993 and EBC-1. In addition to the effects on cell growth, Met shRNA resulted in a dramatic morphologic change in H1993 and EBC-1 cells; at 12 h after virus removal, the majority of cells had converted from rounded and poorly adherent to flattened and adherent appearance.
Flow cytometry was used to characterize the cell cycle profile of EBC-1 and H1993 cells treated with Met shRNA M3 (Fig. 2A). Within 24 h of virus removal, both EBC-1 and H1993 cells sustained a 3- to 4-fold reduction of cells in the S phase, such that the percentage of S-phase cells was decreased from 19% (in EBC-1) and 17% (in H1993) to 5% in each. This decrease in the S phase persisted through the time course, suggesting that the cell cycle was blocked at G1-S. At 48 and 72 h, there was an increase in cells in sub-G1 that was most prominent for EBC-1 (6-fold induction at 72 h), indicative of cell death. This increase in the percentage of sub-G1 cells is consistent with the decrease in cell number observed in Fig. 1B. In addition, both cell lines had a strong decrease in the G2-M population at 48 and 72 h, consistent with a loss of cycling cells, but also suggesting that Met inhibition does not result in a block at G2-M. The increased sub-G1 population prominent in EBC-1 cells suggested an increase in apoptosis in these cells. Western blotting in EBC-1 cells indeed revealed the presence of cleaved PARP, an indicator of apoptosis, at 24 and 48 h (Fig. 2B). H1993 also revealed cleaved PARP, but to a lesser extent than EBC-1 cells, starting at 72 h after virus removal (Fig. 2B). The cleaved PARP was also accompanied by cleaved caspase-3.
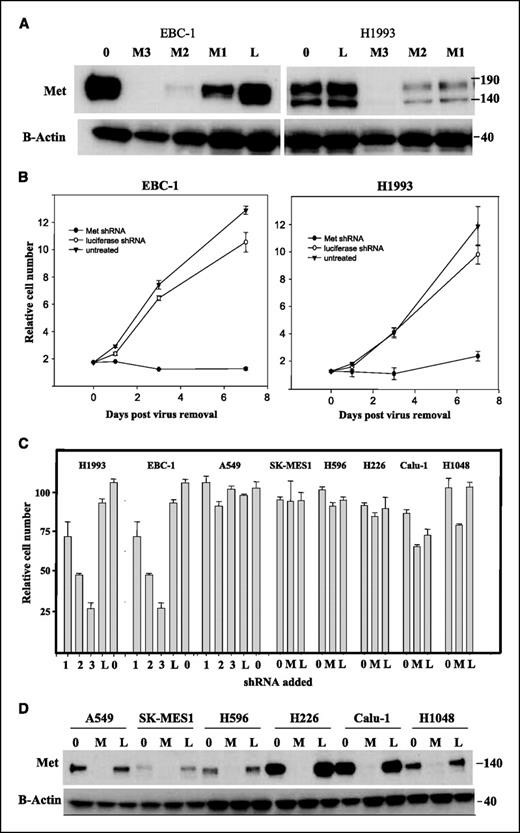 Fig. 1 Inhibition of Met protein expression inhibits growth of EBC-1 and H1993 cells. (Lutterbach B, et al., 2007)
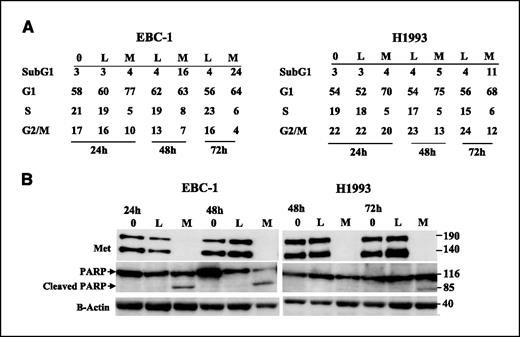 Fig. 2 Met knockdown leads to growth arrest and accumulation of cells in sub-G1. (Lutterbach B, et al., 2007)
Establishment of Crizotinib-Resistant EBC-1 and H1993 Cell Lines
Among the therapeutic targets against MET, crizotinib (PF-02341066) is a multikinase inhibitor targeting ROS1, ALK, and MET. This inhibitor competes with the MET tyrosine kinase domain at the adenosine triphosphate binding site and prevents further activation of the MET receptor and its downstream signal transduction.
Two types of crizotinib-resistant cell lines were established in two parental cell lines with MET amplification, EBC-1, and H1993, using two different methods: the high-dose concentration method and the stepwise escalation method. Cell viability assays were performed to confirm crizotinib resistance. The IC50 values of crizotinib in EBC-1 parental, EBC-1 CRH, and EBC-1 CRS were 0.043 ± 0.05, 2.115 ± 0.04, and 1.731 ± 0.11 μM ± SD, respectively. The IC50 values of H1993 parental, H1993 CRH, and H1993 CRS were 0.283 ± 0.13, 3.564 ± 0.08, and 4.376 ± 0.05 μM ± SD, respectively. The crizotinib-resistant cell lines conferred cross-resistance to tepotinib, and the IC50 values were 0.006 ± 0.01, 8.062 ± 0.00, and 7.635 ± 0.06 μM ± SD in EBC-1 parental, CRH, and CRS cells, respectively, and 0.065 ± 0.09, 9.375 ± NA and 5.05 ± 0.07 μM ± SD in H1933 parental, CRS, and CRH cells, respectively. Similarly, the IC50 value of cabozantinib was 0.089 ± 0.06, 3.618 ± 0.04, and 9.09 ± NA μM ± SD in EBC-1 parental, CRH, and CRS; 2.179 ± 0.09, 13 ± 0.05 and 10.31 ± 0.06 in H1993 parental, CRH and CRS μM ± SD respectively (Fig. 3A). Compared with parental cells, morphological changes in resistant cells could be observed on examination under a light microscope. For EBC-1 CRH, EBC-1 CRS, and H1993 CRH cell lines, a gain of spindle-shaped formation and elongated structure was detected, suggesting the acquisition of epithelial-to-mesenchymal transition (EMT) features (Fig. 3B). Since both the cell lines were known to be MET amplified and to determine any intrinsic changes underlying MET gene amplification, the copy number assay analysis was performed in all the parental and resistant cell lines. All of the parental and resistant cell lines showed higher copy number gain and the resistant cell lines retained the property of MET gene amplification (Fig. 3C).
Different expression features in each parental and resistant cell were detected, with remarkably increased expression in the phosphorylated form for ERK (p-ERK) activation in EBC-1 resistant cell lines, and H1993 CRH cells were observed when treated with crizotinib (Fig. 3D). Next, transcriptomic data of the respective cell lines were analyzed by RNA sequence analysis, and hierarchical clustering analysis was performed among the highly expressed significant 189 genes, which showed a significant difference with a p-value less than 0.05 in parental cells compared with resistant cell lines (Fig. 3E). In both cell lines, the gene expression profiles of parental and resistant cells differed greatly. In addition, the different methods for establishing resistant cells (CRH and CRS, as described above) led to distinct expression profiles.
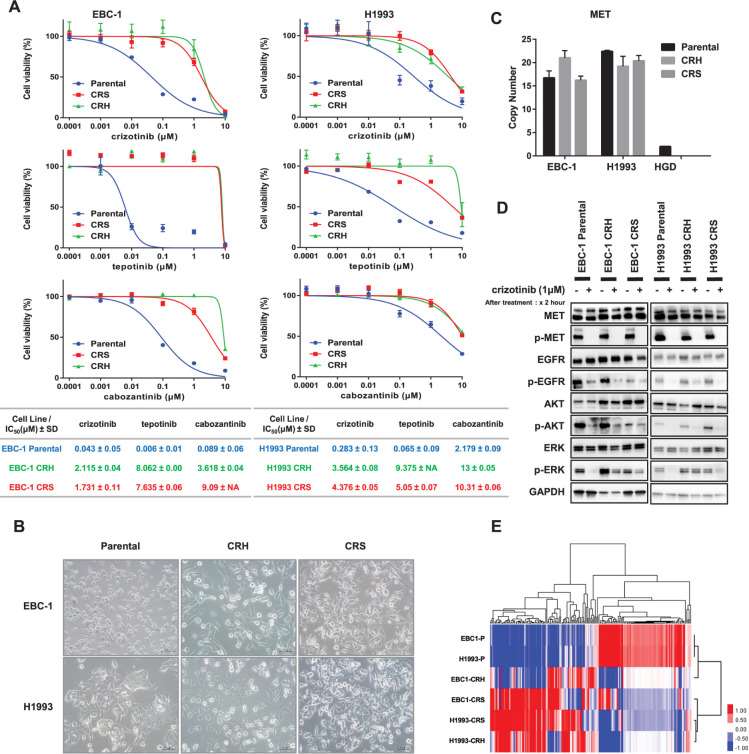 Fig. 3 Establishment of crizotinib-resistant clones. (Thu YM, et al., 2024)
Cell growth is limited by rates of protein synthesis, by the folding rates of its slowest proteins, and—for large cells—by the rates of its protein diffusion.
Ask a Question
Average Rating: 5.0 | 1 Scientist has reviewed this product
Satisfied
I am thrilled with the tumor cell product I obtained from Creative Bioarray. It facilitated my research in immunotherapy.
02 Oct 2022
Ease of use
After sales services
Value for money
Write your own review
- You May Also Need

