hERG Safety Assay
Staffed with a group of experts that have gained years of experience in ion channel safety assays and cardiotoxicity assessment, Creative Bioarray offers hERG safety assay in accordance with the ICH S7B guideline to evaluate compound cardiovascular safety and to support drug development. Inhibition assays of other ion channels are also available.
ICH S7B guideline1 regulates in vitro IKr assay (such as hERG safety assay) and in vitro QT assay for identifying and assessing the potential of a test compound to delay ventricular repolarization. Ventricular repolarization is a complex physiological process determined by the duration of the cardiac action potential. It is the net result of the activities of many highly interdependent membrane ion channels and transporters. Many compounds can affect the activities of the ion channels or transporters, thus have the potential of delaying the ventricular repolarization and leading to prolonged QT interval.

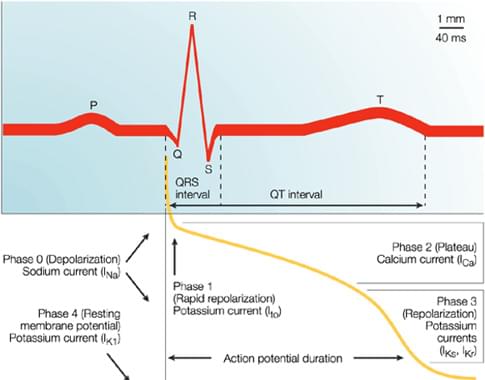
Figure 1, Temporal correlation between action potential duration and the QT interval on the surface ECG2. Typically, the P wave reflects atrial depolarization, the QRS complex reflects ventricular depolarization and the T wave reflects ventricular repolarization (Phase 3). Numerous overlapping ionic currents contribute to the morphology and duration of the ventricular action potential.

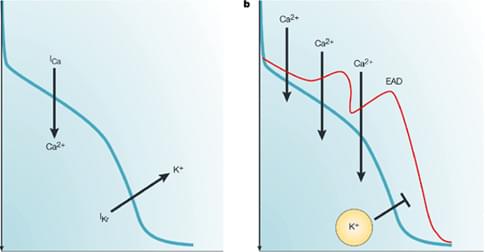
Figure 2, The mechanism of delayed repolarization caused by IKr inhibition2. The balance between inward and outward currents determines the morphology and duration of the action potential, and consequently the duration of the QT interval. Drug-induced inhibition of the IKr current can delay repolarization, and prolong the action potential duration and the QT interval.
The Kv11.1 channel, a potassium ion channel encoded by the human ether-à-go-go-related (hERG) gene (thus also referred to as hERG channel), plays a very critical role in the cardiac action potential repolarization (phase 3). Inhibition of hERG function can cause lengthening of ventricular action potential duration and is the most common mechanism of QT interval prolongation. Therefore, evaluating effects of compounds on hERG activity early in drug discovery can greatly reduce the risk of putting extensive efforts in cardiotoxic drugs and prevent them from entering the market.
Creative Bioarray uses the state-of-the-art automated QPatch-HT system to provide a higher-throughput hERG safety assay with better consistency at a lower cost. For small number of compounds or compounds identified with QPatch, we can also perform conventional whole cell patch clamp assay to get detailed mechanistic information. Our GLP level hERG safety assay can provide high quality data for registration purposes.
| Cell Line | CHO-hERG cells; HEK293-hERG cells |
| Method | Electrophysiology |
| Test Compound Concentration | As required by the client |
| Number of Replicates | As required by the client |
| QC | Seal resistance > 50 MOhms Pre-compound current ≥ 0.1 nA |
| Deliverables | IC50; Report |
In this assay, CHO-hERG cells or HEK293-hERG cells are used to specifically assess the effect of test compounds on the hERG channel. Pre-compound current and post-compound current are measured by patch clamp, and applied to the calculation of hERG inhibition.
The expertise of our technicians allows us to provide customized assays. We are capable of adjusting the assays according to the detailed requirements of our clients. If you have any special requirements or related questions, please do not hesitate to contact us. Our experts will do their best to assist you.
Case Study
1. Extracellular and intracellular recording buffer
| Composition | Extracellular buffer (mM) | Intracellular buffer (mM) |
| CaCl2 | 1.8 | - |
| MgCl2 | 1 | 1 |
| KCl | 4 | 130 |
| NaCl | 137 | - |
| Glucose | 10 | - |
| HEPES | 10 | 10 |
| EGTA | - | 5 |
| MgATP | - | 5 |
| pH | 7.4 | 7.2 |
2. Prepare cells
CHO-hERG cells in the exponential growth phase were collected and resuspended in ECS for later use.
3. Patch clamp test
During the test, hERG current was recorded using a conventional whole-cell patch clamp current technique at room temperature. The cells were seeded in a recording chamber on an inverted microscope, and a single cell in the recording chamber is randomly selected for recording. The cells will be continuously perfused by the perfusion system. The voltage stimulation protocol is shown below.
 Patch clamp command voltage program
4. Data Analysis
- For each cell, the percent inhibition of the test article was calculated from the recorded current using the following formula:
(1-peak tail current recorded after perfusion of the test article / peak tail current recorded by the solvent control perfusion) × 100%
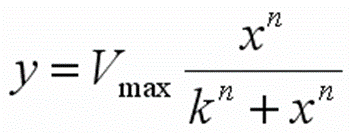
- For each concentration, the percent inhibition is calculated by mean data from all recorded cells, and the IC50 values were derived from the concentration effect curve by the Hill equation.

Note:
y = mean inhibition rate of each cell;
Vmax=100%;
x= nominal concentration;
n= Hill coefficient;
k = test concentration at 50% inhibition.
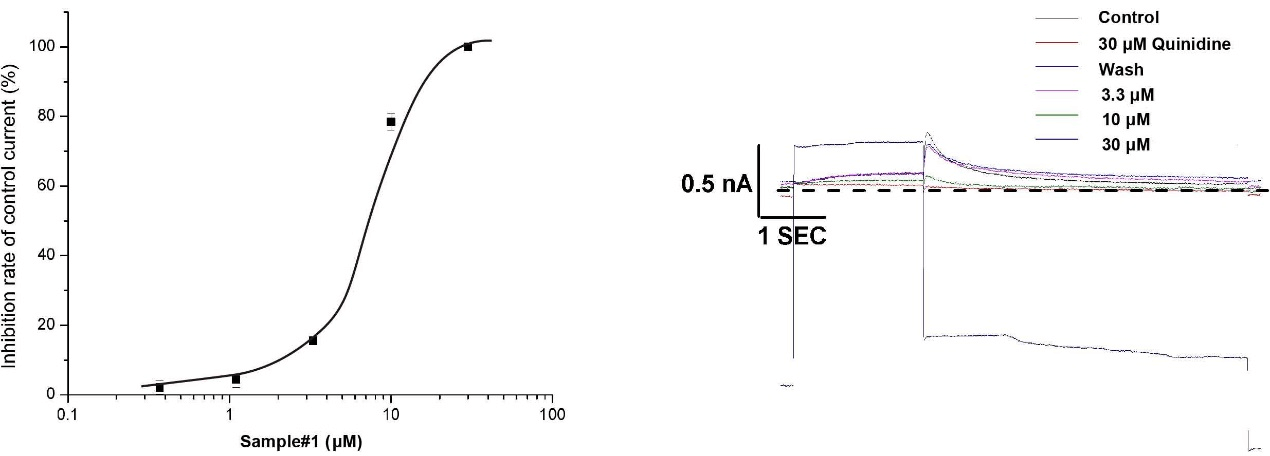
5. Sample data:

References:
- Food, U. S. "Drug Administration (2005). Guidance for industry: ICH S7B nonclinical evaluation of the potential for delayed ventricular repolarization (QT interval prolongation) by human pharmaceuticals." Federal Register 70: 61133-61134.
2, Fermini, Bernard, and Anthony A. Fossa. "The impact of drug-induced QT interval prolongation on drug discovery and development." Nature reviews Drug discovery 2.6 (2003): 439-447.
Explore Other Options

