Spatial Transcriptomics Solutions
- Service Details
- Features
- Applications
- FAQ
- Explore Other Options
Unlock Spatial Insights: Advanced Spatial Transcriptomics Services for Cutting-Edge Research
Spatial transcriptomics technology provides detailed transcriptomic data of samples with precise localization within tissue sections. By integrating these molecular insights with spatial positioning, it offers researchers a powerful way to understand the activity state of cells in their natural environment and their interactions with surrounding tissues. This approach is particularly suited for analyzing the distribution of cell types, intercellular interactions, and the spatial regulation of gene expression in complex tissues.
Leveraging the advanced 10x Visium Spatial Gene Expression platform, Creative Bioarray's Visium Spatial Gene Expression service combines high-throughput sequencing with spatial labeling within tissue sections, allowing high-resolution gene expression detection while maintaining the integrity of tissue morphology. Additionally, the 10x Visium CytAssist enhances the capability for reliable and high-resolution gene expression detection in FFPE tissue sections by optimizing tissue processing and detection protocols, significantly expanding the application scope of spatial transcriptomics technology.
![]() Application scenarios of spatial transcriptomics (Du J, Yang YC, et al. 2023).
Application scenarios of spatial transcriptomics (Du J, Yang YC, et al. 2023).
Our Spatial Transcriptomics Technology
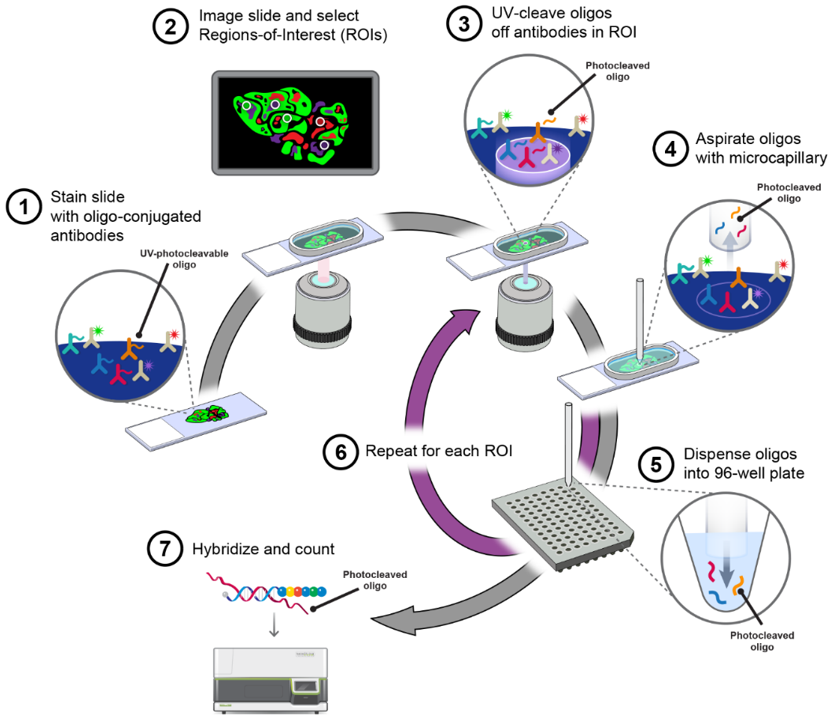
Workflow
1
Sample Preparation
Fresh tissue samples are rapidly frozen and embedded in OCT. FFPE tissue sections undergo deparaffinization. Both fresh tissue samples and FFPE tissue sections are placed in the capture area of the gene expression slide.
2
Tissue Staining and Imaging
FFPE or fresh frozen sections are mounted on slides, followed by H&E staining or immunofluorescence staining, then scanned for imaging.
3
Tissue Permeabilization and cDNA Synthesis
Enzymatic treatment is used to disrupt cell structure and release mRNA, which binds to capture probes on the slide. A fluorescently labeled reverse transcriptase mixture is used to reverse transcribe the released mRNA into cDNA.
4
Library Construction and Sequencing
Prepare sequencing libraries and perform deep sequencing on a high-throughput sequencing platform to obtain gene expression data from each location.
5
Data Analysis and Visualization
Conduct quality control, alignment, and quantitative analysis on the sequencing data. Use spatial barcode information to determine the location of gene expression and analyze spatial distribution patterns of gene expression.
10x Visium
The Visium Spatial Gene Expression Slide contains 4 array areas (6.5 mm × 6.5 mm, each with approximately 5000 Barcoded spots).
- Sample: Fresh frozen tissue
- Species: Not limited
![]() Composition of the Visium spatial gene expression slide-Diagram from 10x Genomics.
Composition of the Visium spatial gene expression slide-Diagram from 10x Genomics.
10x Visium CytAssist
The Visium CytAssist Slide includes 2 array areas (6.5 mm x 6.5 mm or 11 mm x 11 mm, with approximately 5000 or 14000 Barcoded spots per array), each spot has a diameter of 55 µm and contains a unique spatial barcoding.
- Sample: Fresh frozen and FFPE tissue
- Species: Human and mouse.
![]() Composition of the Visium CytAssist spatial gene expression slide
Composition of the Visium CytAssist spatial gene expression slide
10x Visium HD
The Visium HD Spatial Gene Expression slide contains two 6.5 x 6.5 mm capture areas, where oligonucleotides are seamlessly arranged in millions of gapless 2 x 2 µm barcoded squares, enabling single-cell level spatial resolution.
- Sample: FFPE, fresh frozen, and fixed frozen tissues
- Species: Human and mouse.
![]() Visium HD space gene expression slides-Diagram from 10x Genomics.
Visium HD space gene expression slides-Diagram from 10x Genomics.
Features
High-Resolution Detection
Utilizing the advanced Visium platform, this service offers high-precision spatial resolution.
Comprehensive Gene Coverage
With high-throughput sequencing technology, it can detect the expression of thousands of genes within a single tissue section.
Multi-Sample Compatibility
Compatible with both fresh tissues and formalin-fixed, paraffin-embedded (FFPE) tissues.
Powerful Data Analysis Tools
Offering user-friendly data analysis and visualization tools.
Scalability and Flexibility
Supports various experimental designs and data analysis needs.
Compatibility with Histological Staining
Compatible with traditional hematoxylin and eosin (H&E) staining or immunofluorescence (IF) staining.
What Can You Do with Our Spatial Transcriptomics Solutions?
- Oncology: Tumor microenvironment, tumor heterogeneity, cancer progression and metastasis mechanisms.
- Comprehensive Gene Coverage: With high-throughput sequencing technology, it can detect the expression of thousands of genes within a single tissue section.
- Neuroscience: Brain mapping, nervous system development, neurodegenerative diseases.
- Immunology: Immune cell infiltration, immune microenvironment, allergies and autoimmune diseases, infectious diseases.
- Pathology: Pathological slides analysis, disease biomarker discovery.
FAQ
1. What is spatial transcriptomics, and why is it important?
Spatial transcriptomics is a technology that describes expression profiling of cells with spatial context. Which allows scientists to see differences in expression across organs, tissues and diseases by looking at transcripts at multiple spatial sites within a tissue. By combining conventional single-cell sequencing technologies with in situ technologies and other omics approaches, spatial transcriptomics enables the study of cellular heterogeneity with spatial resolution. It provides a more specific research agenda for disease research and contributes to disease biology and targeted therapeutic development.
2. What should be done with frozen embedded samples for spatial transcriptomics?
There are two common methods: pre-freezing and embedding or simultaneous freezing and embedding. Pre-freezing process is a quick, cold immersion in isopentane with a pre-cooled forceps, till the tissue is completely frozen, and then embedding in OCT compound. The simultaneous approach consists of depositing new tissue in a petri dish, adding room temperature OCT embedding medium, so that an OCT coat surrounds the tissue, and placing it in an OCT embedding mould and freezing on dry ice or in isopentane.
3. Can samples be directly frozen in liquid nitrogen?
Direct freezing in liquid nitrogen is not recommended, as the boiling process might cause cavitation around the tissue, leading to asynchronous cooling in different regions, potentially altering the internal structure or even causing tissue fragmentation.
4. What species and tissue samples are suitable for spatial transcriptomics?
Visium spatial transcriptomics services utilize fresh tissue samples and poly(A)-based capture chemistry, making it species-independent. Most fresh tissues, such as tumor, brain, heart, liver, etc., are suitable. Tissues must be immediately frozen following extraction to preserve cellular and gene expression integrity - ideally within 30 minutes of collection. Visium CytAssist, in contrast, uses probe detection, mainly for fresh frozen, fixed frozen, and formalin-fixed paraffin-embedded (FFPE) tissue sections of human and mouse specimens.
5. How does the Spatial technology achieve spatial localization of gene expression?
The Visium Spatial slides are equipped with a high-density array of oligonucleotide probes, each carrying a unique spatial barcode. After permeabilization, mRNA is released and binds to the probes, with the resulting transcript information acquired during sequencing carrying spatial barcode data. Software analysis then precisely matches gene expression data with the spatial location on the tissue section.
6. What is the role of pre-treatment steps for FFPE tissues?
Dewaxing removes paraffin to re-expose the tissue, while antigen retrieval restores antigen epitopes masked during the fixation process, thereby enhancing mRNA accessibility. This facilitates the efficient binding of spatial barcode probes and accurate gene expression capture.
7. How can spatial transcriptomics data be maximally utilized for analysis?
For a biological perspective, integrate spatial transcriptomics data with other data types like single-cell RNA sequencing, whole-genome sequencing, tissue histology, and immunofluorescence staining to give you the full biological picture. Dedicated software and bioinformatics tools can also be used to visualize and interpret spatial transcriptomics data.
Reference
- Du J, Yang YC, et al. Advances in spatial transcriptomics and related data analysis strategies. J Transl Med. 2023. 21(1):330.
Related Services
Explore Other Options
