ONLINE INQUIRY
Human Liver Fibroblasts
Cat.No.: CSC-8241W
Species: Human
Source: Liver
Morphology: Fibroblasts
Cell Type: Fibroblast
- Specification
- Background
- Scientific Data
- Q & A
- Customer Review
Never can primary cells be kept at -20 °C.
Human liver fibroblasts isolated from liver tissue display an abundance of proliferative and differentiation potential. These cells are spindle- or irregular-shaped and have ovoid nuclei, and so they are easily visible in the microscope. In adult livers, fibroblasts are concentrated in portal tracts, the region around central veins and occasionally in the parenchyma of the liver. They primarily produce and secrete extracellular matrix (ECM) components such as collagen, fibronectin, laminin, glycoproteins and proteoglycans. These molecules make up a fibrous system that keeps the liver structural integrity and is responsible for maintaining liver metabolism and detoxification.
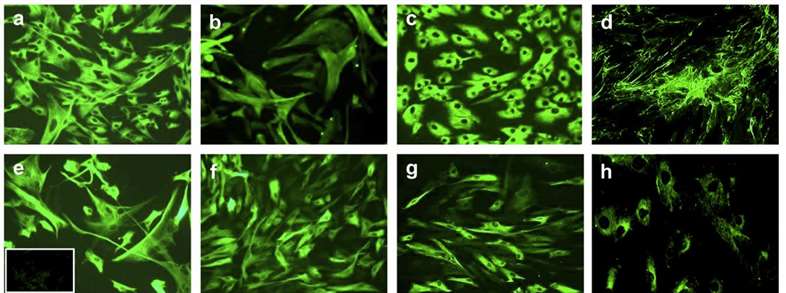 Fig. 1. Morphology and immunophenotype of cultured human liver fibroblasts from human adult liver. (Jodon de Villeroché, V., and Brouty-Boyé, D. 2008)
In normal physiological states, human liver fibroblasts are in the dormant mode. But if the liver is damaged or activated by inflammation, these fibroblasts are stimulated and multiply into myofibroblasts (MFs). MFs can generate and release large amounts of ECM elements leading to liver fibrosis. It is a widespread pathological condition in the progression of multiple chronic liver disorders towards cirrhosis, so activation of human liver fibroblasts has become an attractive topic for liver fibrosis research.
By exploring the cellular biology, activation pathways and function of these cells in liver fibrosis, a number of therapeutic approaches to human liver fibroblasts have been identified. These include preventing human liver fibroblast proliferation and activation, and encouraging MFs apoptosis or differentiation to reverse or reduce liver fibrosis. There are also methods using transplantation of human liver fibroblasts to replace liver damage. But no treatment for liver fibrosis is yet effective. It would be enormously social and economic for the treatment challenge to be resolved.
Now, it's human liver fibroblasts that play the central role in studying liver fibrosis, developing liver disease models, drug screening and toxicology testing, cell therapy, and liver repair. It's been used widely in liver diseases.
Generation and Characterization of Human Liver Fibroblast Induced Pluripotent Stem Cells
The human liver fibroblasts (HLFs) were isolated from a Combined hepatocellular-cholangiocarcinoma (cHCC-CC) patient. They were reprogrammed into pluripotent stem cells (HLF iPSCs) using retroviral transduction of four factors include - OCT4, SOX2, KLF4, and c-MYC (OSKM) (Fig. 1A). Human skin fibroblasts (HSFs) were also reprogrammed into iPSCs as a normal control (Con iPSCs). Both HLF and Con iPSC colonies expanded well with typical hESC-like morphology (Fig. 1B). The HLF iPSCs were free of mycoplasma contamination (Fig. 1C). Both types retained undifferentiated characteristics with strong alkaline phosphatase activity (Fig. 1D). The short tandem repeats profile of HLF iPSCs matched the original fibroblasts (Fig. 1E).
Real-time PCR showed higher mRNA expressions of pluripotency markers (OCT4, SOX2, NANOG, REX1) in Con iPSCs and HLF iPSCs compared to fibroblasts (Fig. 2A). Immunostaining confirmed high expression of pluripotent markers such as OCT4, TRA-1-60, NANOG, and SSEA4 proteins in both iPSC types (Fig. 2B).
In vitro, embryoid bodies enabled spontaneous differentiation of iPSCs into the three germ layers, as shown by markers for ectoderm (TUJ1), mesoderm (α-SMA), and endoderm (FOXA2) (Fig. 3A). In vivo, iPSCs induced teratomas containing ectoderm (pigment epithelium with melanocytes or neural rosettes), mesoderm (cartilage), and endoderm (gut-like epithelium), confirmed by haematoxylin and eosin staining (Fig. 3B). These findings indicate that HLF iPSCs maintain pluripotency both in vitro and in vivo, similar to Con iPSCs.
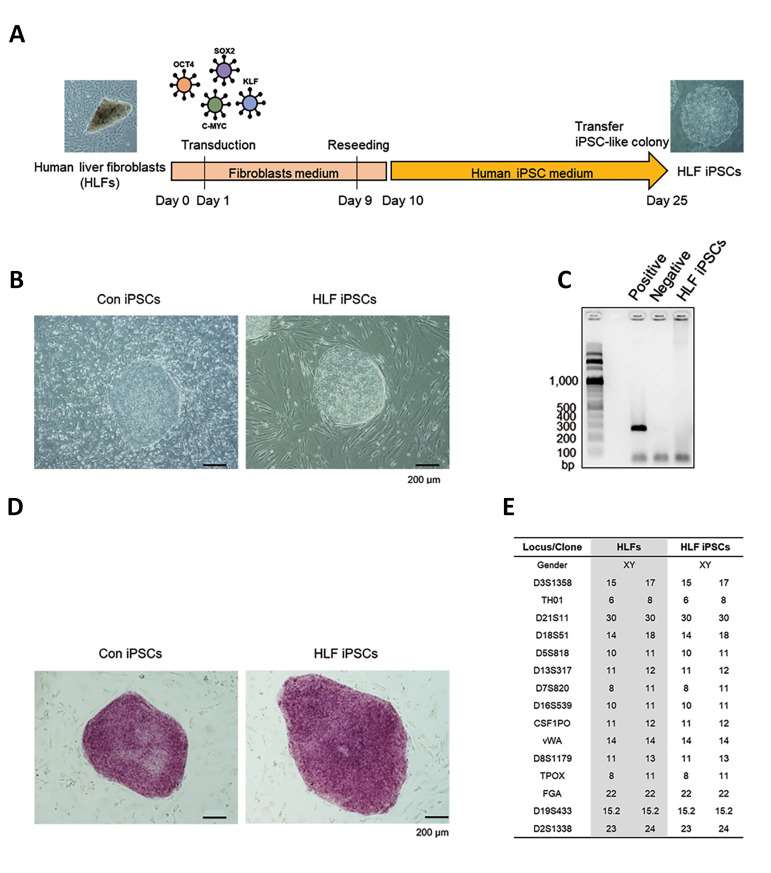 Fig. 1. Generation of HLF iPSCs. (A) iPSC generation using HLFs and HSFs with OSKM. (B) Morphology of control iPSCs and HLF iPSCs. (C) Mycoplasma test for HLF iPSCs. (D) Alkaline phosphatase activity in iPSCs. (E) STR profiling for HLFs and iPSCs (bar = 200 μm) (Ahn, H., Ryu, J., et al., 2022).
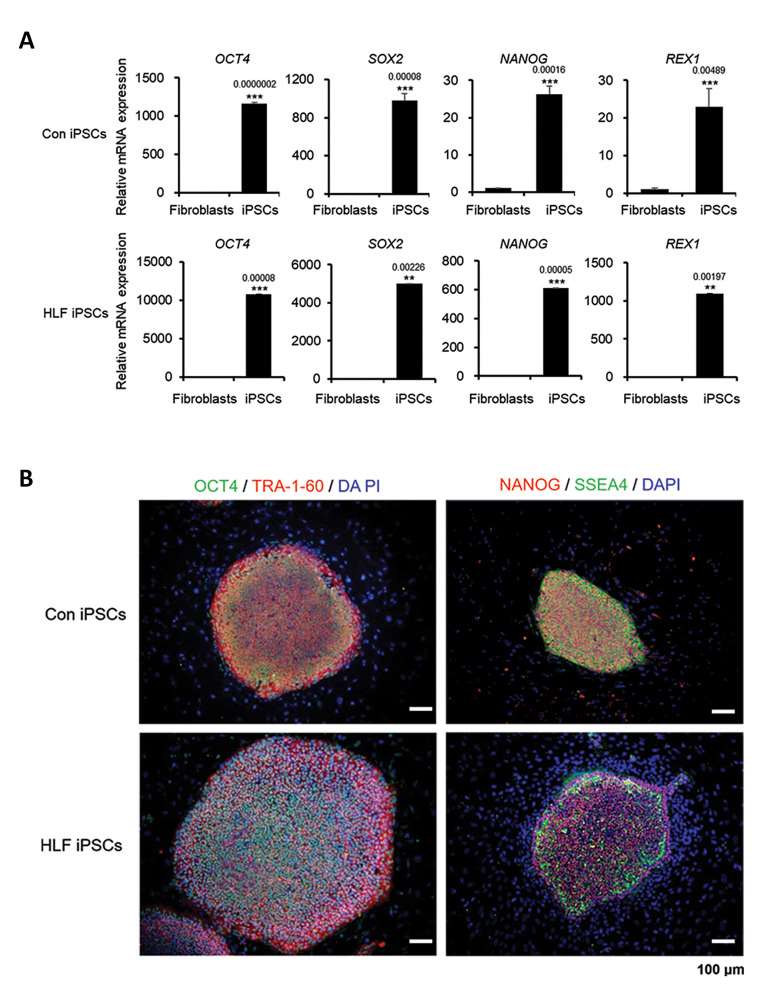 Fig. 2. Pluripotency markers in cHCC-CC-derived HLF iPSCs. (A) mRNA levels of OCT4, SOX2, NANOG, REX-1 in control and cHCC-CC patient fibroblasts and iPSCs. (B) Immunostaining of control and cHCC-CC patient-derived iPSCs for pluripotency markers (Ahn, H., Ryu, J., et al., 2022)
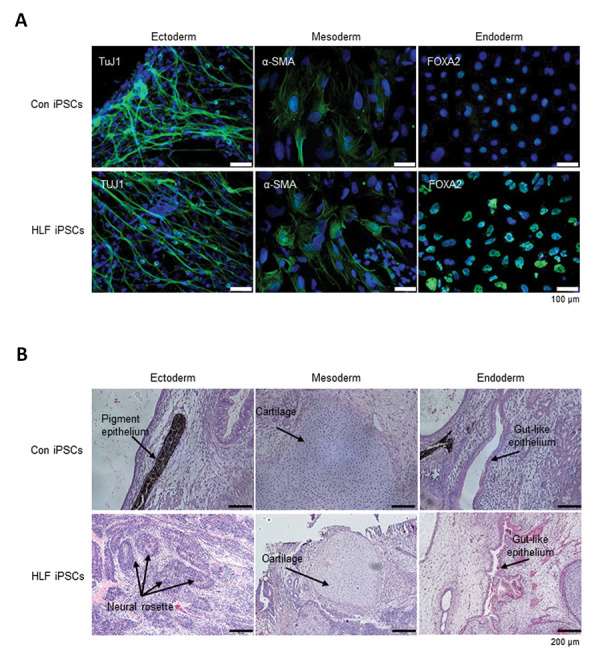 Fig. 3. Differentiation of cHCC-CC-derived HLF iPSCs. (A) In vitro differentiation into three germ layers via EB formation. (B) In vivo differentiation by teratoma formation, showing all germ layers (Ahn, H., Ryu, J., et al., 2022).
Myostatin activated human primary liver fibroblasts
Serum myostatin levels were increased with liver fibrosis progression in hepatocellular carcinoma patients who underwent liver resection (Fig. 4A). To clarify the impact of myostatin on liver fibrosis, Yoshio's team cultured human hepatic stellate cells (LX-2) and primary human liver fibroblasts (NF1-3) with recombinant myostatin and transforming growth factor beta (TGF-ß) in vitro. Addition of myostatin increased the expression of ACTA2, COLIAI, and TIMPI in LX-2 cells and primary human liver fibroblasts in a dosedependent manner, as well as TGFB1 (Fig. 4B). All three primary human liver fibroblast lines (NF1-3) were activated by myostatin or TGF-ß (Fig. 4C). Recently, IL-11 was identified as a crucial factor for cardiovascular fibrosis, pulmonary fibrosis, liver fibrosis, and liver steatosis.
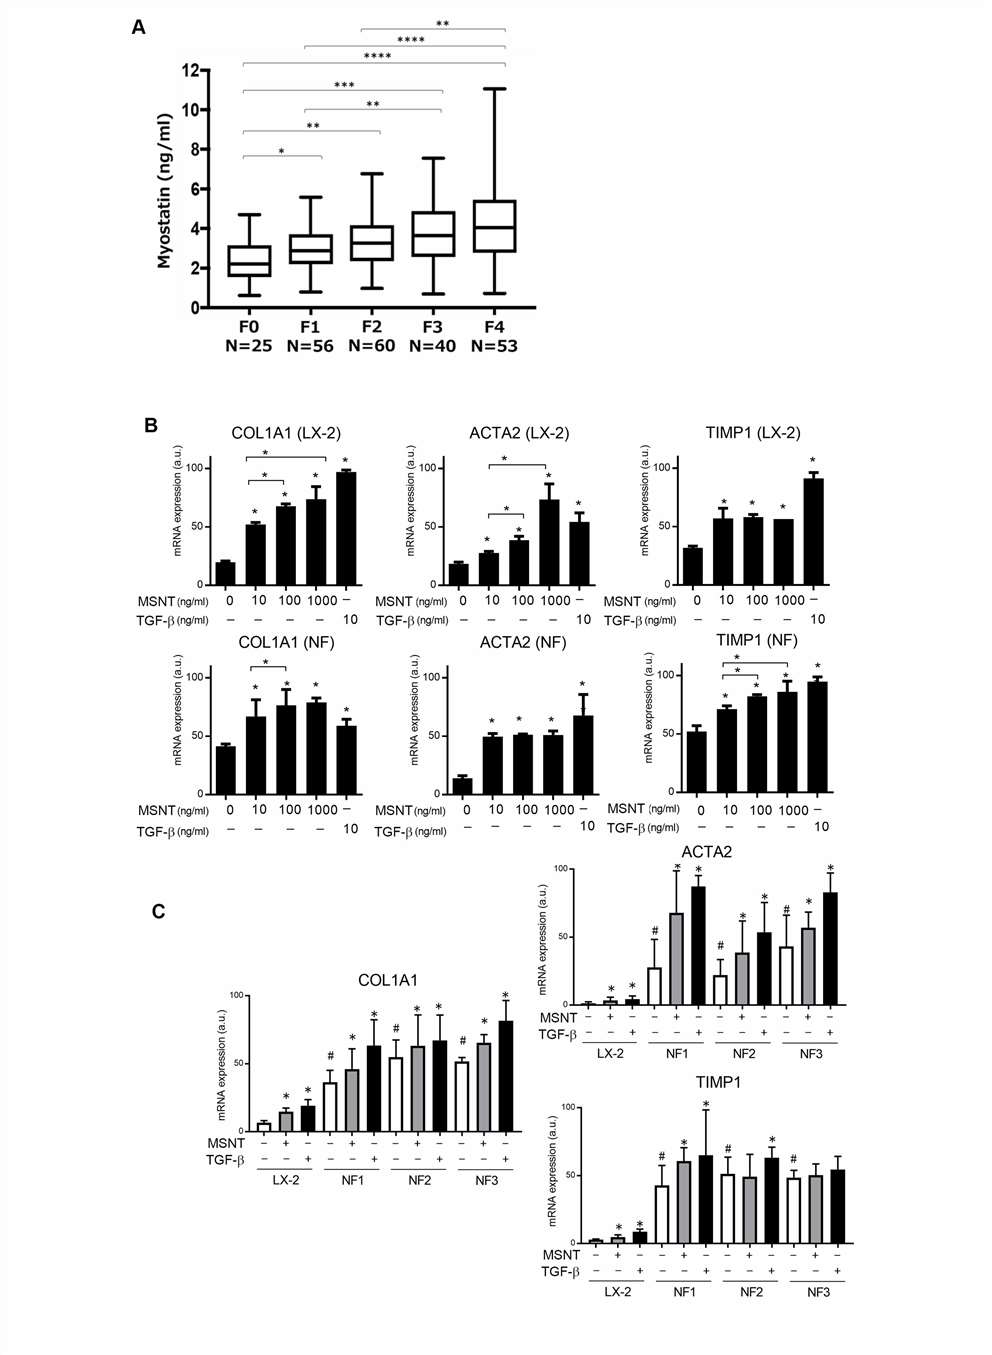 Fig. 4. Myostatin activates liver fibroblasts. (A) Myostatin levels in HCC patients' serum across fibrosis stages 0-4. (B) ACTA2, COLIA1, and TIMP1 expression level of LX-2 cells and NF1-3 after treated with myostatin or TGF-β. (C) Comparison of stimulated vs. non-stimulated LX-2 and primary fibroblasts. (Yoshio, S., Shimagaki, T., et al., 2021)
iPSCs derived from human mesenchymal stem cells and human liver fibroblasts display similar proliferative characteristics and DNA damage response as hESC
iMSC and iLC2 were generated by retroviral transduction of Human mesenchymal stem cells (MSC) and Primary human liver fibroblasts (LC2). Both iLC2 and iMSC demonstrate classical iPSC features. Using flow cytometry to measure ROS levels, Fan's team found no significant differences between human embryonic stem cells (hESC lines: H1 and H9) and iPSC lines (iMSC and iLC2), but both showed a significant increase in ROS compared to parental MSC and LC2 cells (Fig. 5A). H1 and H9 cells had a lower mean number of foci per cell compared to LC2 and MSC (Fig. 5B and C). Importantly, iPSCs derived from MSC also showed low γH2AX foci similar to hESCs, significantly different from their parental cells (iMSC vs MSC, p = 0.001; iLC2 vs LC2, p = 0.002) (Fig. 5B and C). Both hESCs and iPSCs displayed a high percentage of cells in the S phase (48-55%), while parental cells (MSC and LC2) had a lower percentage (30-37%) (Fig. 5E). Although there were no significant differences in S phase percentages between H1 or H9 and iLC2, iMSC had a small but significant increase in S phase cells compared to H1 and H9 (Fig. 5E). In the G0/G1 phase, hESCs and iPSCs were significantly different from parental cells (MSC and LC2) , but there were no significant differences between H9 and iLC2. However, iMSC cells showed a significant decrease in G0/G1 phase cells compared to H1 and H9 (Fig. 5E).
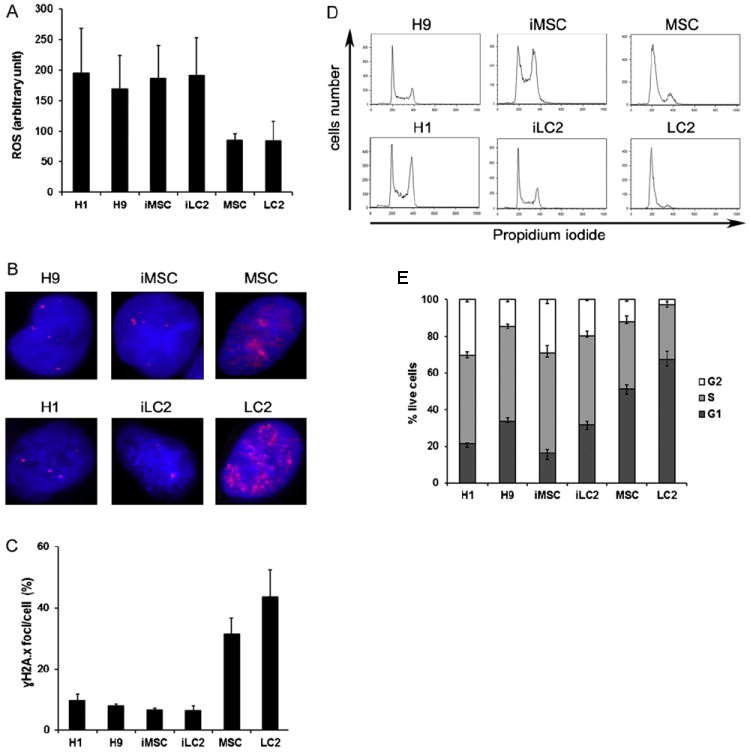 Fig. 5. ROS levels, γH2AX expression, and cell cycle analysis in hESC, iPSC, and control cells. (A) ROS measured using H2DCFDA staining and flow cytometry. (B) γH2AX visualized by immunofluorescence. (C) Cell cycle analyzed using propidium iodide staining. (D) Cell cycle profile. (E) Percentage of live cells. (Fan, J., Robert, C., et al., 2011)
It is about 80% -90% and different lots has different data.
Ask a Question
Write your own review

