ONLINE INQUIRY

Human Oligodendrocyte Precursor Cells (HOPC)
Cat.No.: CSC-7746W
Species: Human
Source: Brain
Cell Type: Oligodendrocyte Progenitor Cell; Glial Cell
- Specification
- Background
- Scientific Data
- Q & A
- Customer Review
Oligodendrocyte precursor cells (OPCs) are a type of tissue-resident glial cells found throughout the central nervous system (CNS), accounting for approximately 5% of all CNS cells and persisting from development through adulthood and into ageing. The canonical role of OPCs is to generate myelinating oligodendrocytes. However, OPCs have long been thought to perform additional functions beyond their traditional role as precursors.
Proliferation and Differentiation to Myelinating Oligodendrocytes
The primary function of OPCs is to generate oligodendrocytes, a process that can occur in a variety of contexts depending on the needs of the tissue. The generation of new oligodendrocytes has been shown to be important for specific motor, learning, and memory tasks.
Synaptic Input to OPCs
Adult OPCs are the only glial cells that receive direct synaptic input, allowing themselves to monitor neuronal activity via neurotransmitter receptor-mediated signaling. All postnatal OPCs are thought to receive this form of synaptic input, which is lost once they differentiate into myelinating oligodendrocytes.
OPCs also express multiple genes encoding GABA receptors including ionotropic GABAA and metabotropic GABAB receptors with various subunit compositions. In addition, OPCs receive direct synaptic input from interneurons in the developing hippocampus and cerebral cortex.
Neuromodulation by OPCs
In addition to receiving synaptic input, OPCs interact with neurons along multiple signaling axes to modulate neuronal signaling. NG2, one of the hallmark membrane proteins of OPCs, which can directly modulate neuron-neuron synapses when it is cleaved by α- and γ-secretases and release its ectodomain into the ECM. Either genetic ablation of NG2 or pharmacological inhibition of the α-secretase ADAM10 resulted in significantly impaired NMDAR-dependent long-term potentiation and sensorimotor gating.
OPCs in Neuropathology and Aging
In diseases such as multiple sclerosis, myelin-producing oligodendrocytes undergo cell death, leading to demyelination. Following this demyelinating injury, spontaneous regenerative response can lead to the production of new oligodendrocytes and myelin. Genetic fate mapping has conclusively shown that these new oligodendrocytes arise from OPCs both in the surrounding parenchyma as well as from neurogenic zones.
Primary cultures of OPCs are suitable for studying the proliferation, survival and differentiation of OPCs as well as the effect of molecules of interest on OPCs and oligodendrocyte biology. In addition, different protocols have been developed to study myelination by co-culturing oligodendrocytes with neurons or synthetic nanofibers.
Cell-Type Association with Genetic Risk of PD
The research was conducted using fresh-frozen postmortem brain tissues obtained from four PD patients, two of which had the LRRK2 p.G2019S mutation and the other two had the GBA1 mutation (one with p.L444P and one with p.E326K), along with two healthy controls (HC).
Integration of snRNA-seq data, which includes all expressed genes, with PD genome-wide association studies (GWAS) showed the significant association of oligodendrocytes (ODCs), oligodendrocyte precursor cells (OPCs) and microglia (MG) with PD-linked risk loci (Fig. 1A). Next, we performed differential expression gene analysis to identify dysregulated genes between PD and controls in ODCs and OPCs. While 1040 and 543 genes were differentially expressed between GBA1 and control samples in ODCs and OPCs, respectively, only 278 genes in ODCs and 108 genes in OPCs were differentially expressed between LRRK2 and control samples (Fig. 1B). Using all the DEGs, MAGMA indicated that OPCs had the highest association with PD-linked risk loci (Fig. 1C). The most prominent MAGMA association was observed among DEGs in OPCs when comparing LRRK2 vs HC, aligning with earlier findings indicating highest LRRK2 expression in OPCs. Enriched biological processes in up-regulated DEGs (Fig. 1D) exhibited negative regulation of inclusion body assembly (in GBA1/Control ODCs), regulation of microtubule nucleation (in LRRK2/Control ODCs), positive regulation of tau-protein kinase activity (in GBA1/Control OPCs) and regulation of protein polymerization (in LRRK2/Control OPCs). On the other hand, enriched biological processes in down-regulated DEGs exhibited protein processing involved in protein targeting to mitochondria (in GBA1/Control ODCs), regulation of potassium ion transport (in LRRK2/Control ODCs), modulation of chemical synaptic transmission (in GBA1/Control OPCs) and cholesterol biosynthetic process (in LRRK2/Control OPCs). The low overlap between DEGs of LRRK2 or GBA1 compared to Healthy Controls, along with the distinct enriched biological processes in LRRK2 and GBA1 DEGs, indicates that GBA1 and LRRK2 mutations have unique molecular impacts in PD.
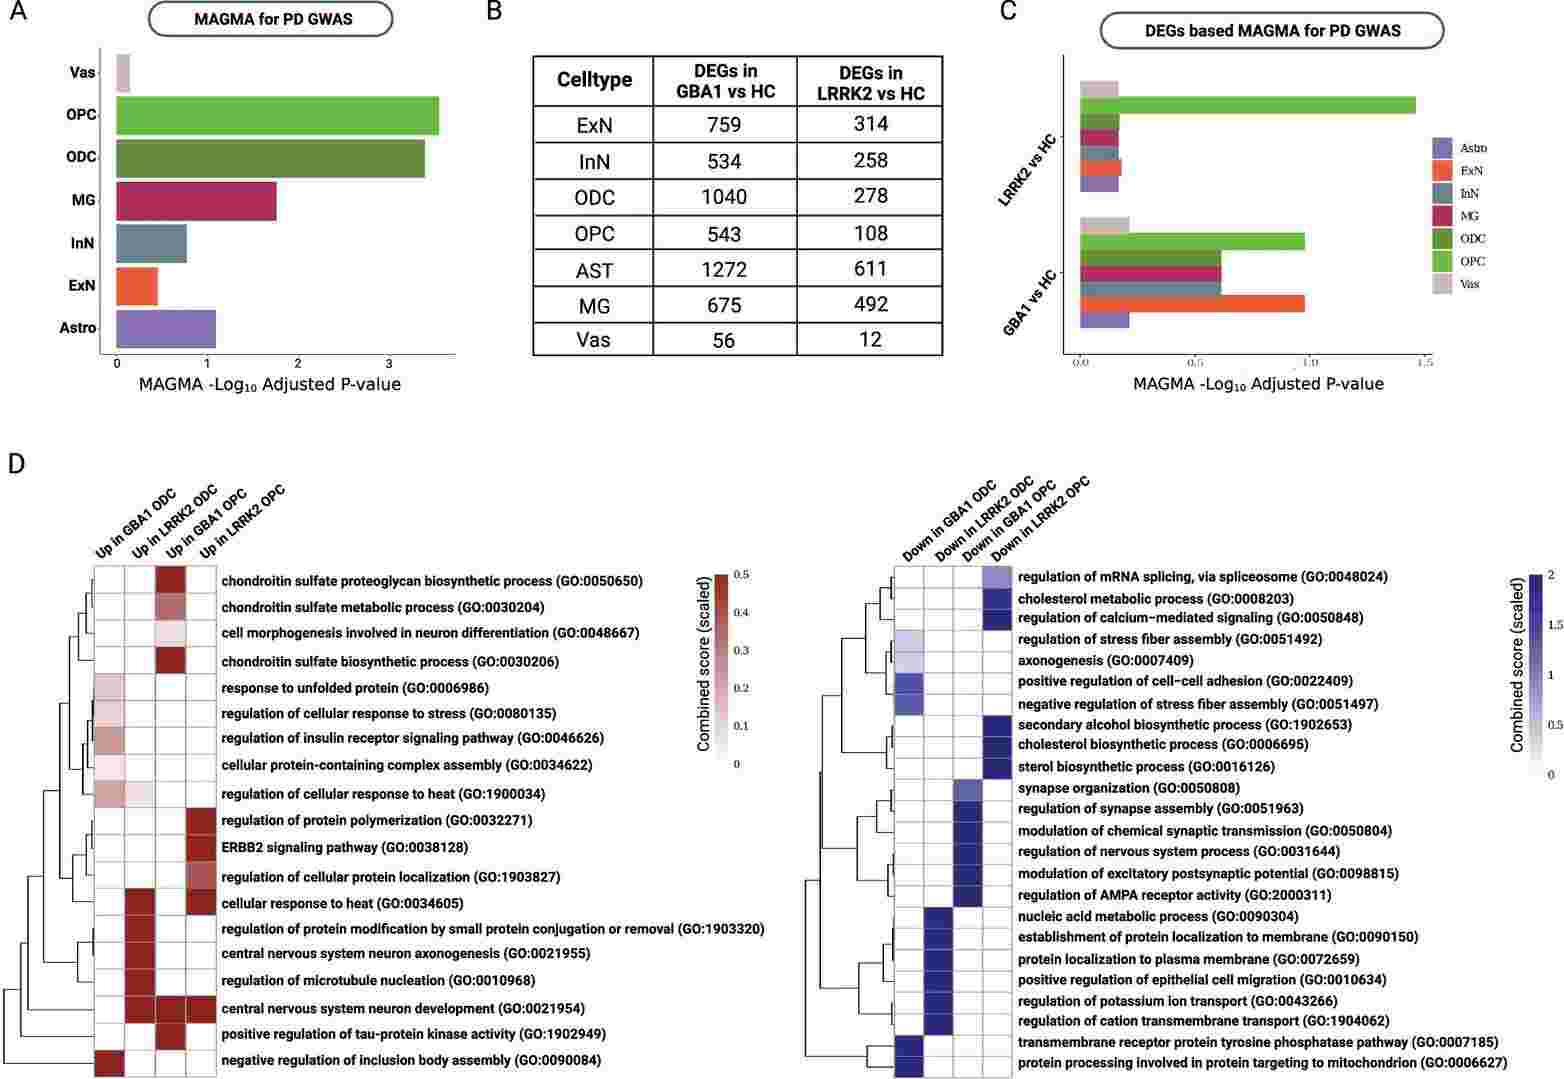 Fig. 1 Association of PD susceptibility with ODCs and OPCs (Dehestani, Mohammad, et al. 2024). A Multi-marker analysis of genomic annotation (MAGMA) gene set enrichment based on all the 88,876 high quality nuclei showed significant associations with ODCs and OPCs. B Number of differentially expressed genes (DEGs) in each comparison and cell-type. C MAGMA gene set enrichment based on DEGs in LRRK2 vs HC (upper) and in GBA1 vs HC (lower). D Gene ontology enrichment analysis of up-regulated (left) or down-regulated (right) genes.
Molecular Analysis of Metformin-Induced Gene Expression in Adult and Paediatric A2B5+ and A2B5- Cells
For the current study, bulk whole-cell RNA sequencing was performed on adult and paediatric A2B5+ (A+) and A2B5- (A-) cells after they were maintained in culture for 6 days to allow processes to grow out and then exposed or not exposed to metformin for 48 h.
There was a relatively greater proportion of down-regulated versus up-regulated genes for the paediatric A2B5+ cells (Fig. 2A), a pattern not observed for the adult A2B5+ cells or mature cells (A-) from either age group (Fig. 2A). Fewer than 3% of genes for any cell type in response to metformin were shared with any other cell type; this applied to both genes with differentially increased or decreased expression (Fig. 2A and B). Bubble plots showing the relative expression of the top 10 up- or down-differentially regulated genes induced by metformin for each cell type with corresponding expression in the other cell types (Fig. 2D and E).
Up-regulated pathways in adult A+ cells (Fig. 2F) encompassed cell process outgrowth, including axonal outgrowth and synapse formation, as well as lipid metabolism, specifically fat cell differentiation. Conversely, paediatric A+ cells exhibited down-regulated pathways associated with cellular morphology, development and synaptic transmission (Fig. 2F). Notably, paediatric A+ cells demonstrated up-regulated mitochondrial pathways, potentially indicating enhanced mitochondrial activity (Fig. 2F). However, no differentially regulated pathways related to cell death or cycling were identified across any cell type.
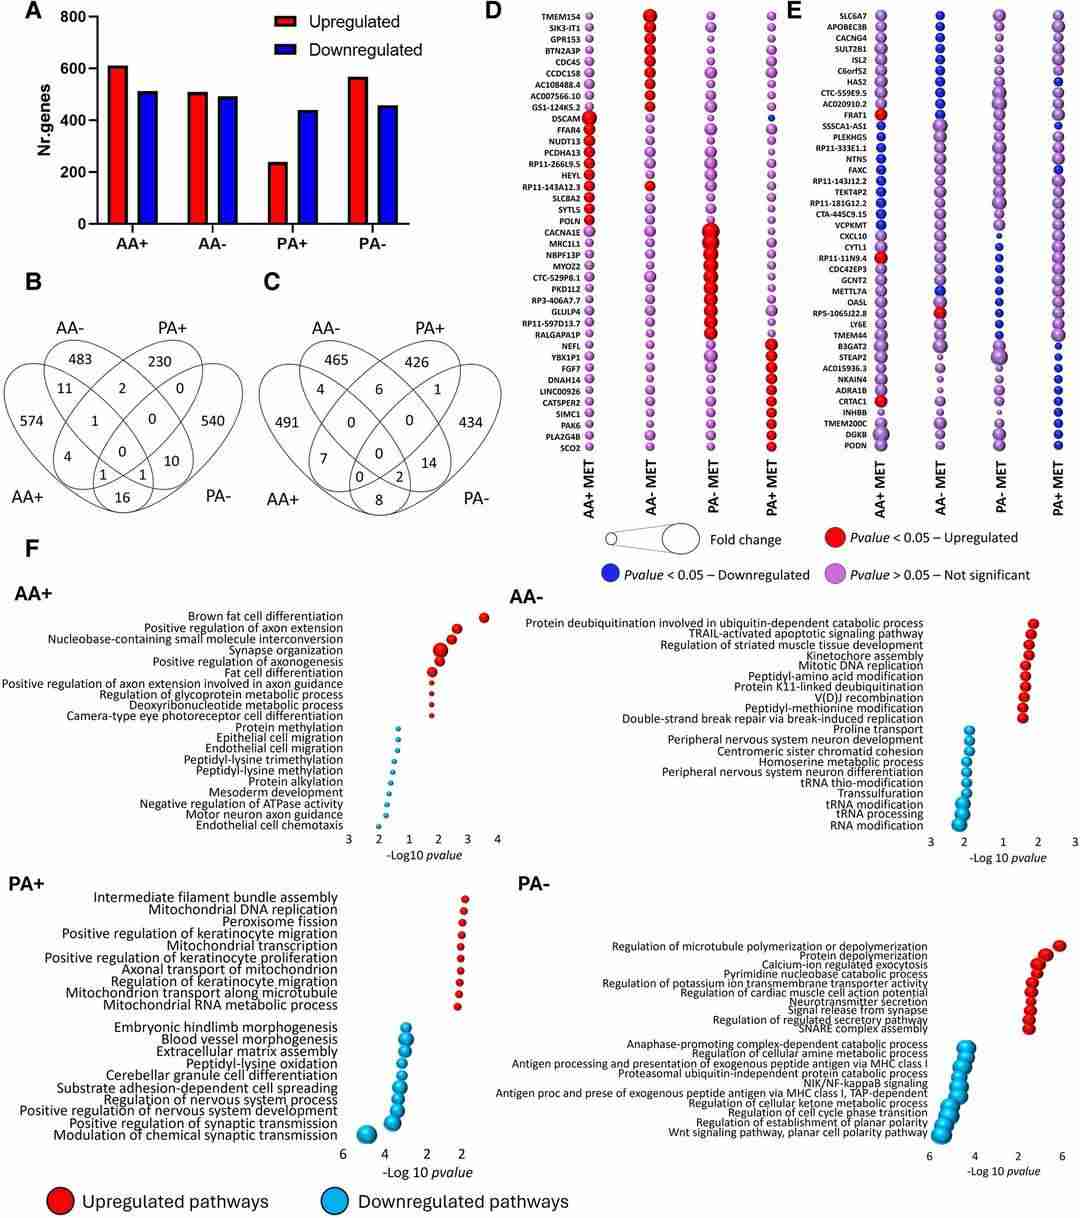 Fig. 2. Distinct cell type and age-related differences in gene expression induced by metformin (Mohammadnia, Abdulshakour, et al. 2024).
Ask a Question
Write your own review

Description: Human Schwann Cells (HSC) from Creative Bioarray are isolated from human spinal nerves. HSC are cryopreserved at passage one and delivered frozen. Each vial contains >5 x 10^5 cells in 1 ml volume. HSC are characterized by immunofluorescent method with antibodies to S-100, GFAP and CD90. HSC are negative for HIV-1, HBV, HCV, mycoplasma, bacteria, yeast and fungi. HSC are guaranteed to further culture in the conditions provided by Creative Bioarray.
Description: Human Retinal Astrocytes (HRA) from Creative Bioarray are isolated from human retina. HRA are cryopreserved at passage one and delivered frozen. Each vial contains >5 x 10^5 cells in 1 ml volume. HRA are characterized by immunofluorescent method with antibody to GFAP. HRA are negative for HIV-1, HBV, HCV, mycoplasma, bacteria, yeast and fungi. HRA are guaranteed to further expand for 15 population doublings at the conditions provided by Creative Bioarray.
Description: Human Perineurial Cells (HPC) from Creative Bioarray Research Laboratories are isolated from human spinal nerves. HPNC are cryopreserved at passage one and delivered frozen. Each vial contains >5 x 10^5 cells in 1 ml volume. HPNC are characterized by immunofluorescent method with antibodies to Vimentin, S100, GFAP and CD90. HPNC are negative for HIV-1, HBV, HCV, mycoplasma, bacteria, yeast and fungi. HPNC are guaranteed to further expand for 15 population doublings in the conditions provided by Creative Bioarray.
Description: Human Oligodendrocyte Precursor Cell-oligospheres (HOPC-os) from Creative Bioarray are isolated from human oligodendrocyte precursor cell cultures. HOPC-os are cryopreserved and delivered frozen. Each vial contains >1 x 10^6 cells in 1 ml volume. HOPC-os are characterized by immunofluorescent method with antibodies to A2B5 and nestin. HOPC-os are negative for HIV-1, HBV, HCV, mycoplasma, bacteria, yeast and fungi. HOPC-os are guaranteed to further culture at the condition provided by Creative Bioarray.
Description: Human Neurons-hippocampal (HN-h) from Creative Bioarray are isolated from hippocampal tissue of the brain. HHN are cryopreserved at primary cultures and delivered frozen. Each vial contains >1 x 10^6 cells in 1 ml volume. HHN are characterized by immunofluorescent method with antibodies to neurafilament, MAP2, and beta-tubulin III. HHN are negative for HIV-1, HBV, HCV, mycoplasma, bacteria, yeast and fungi. HHN are guaranteed to further culture in the conditions provided by Creative Bioarray.
Description: Human Neurons-brain stem (HMBS) from Creative Bioarray are isolated from human brain stem tissue. HN-bs are cryopreserved at primary culture and delivered frozen. Each vial contains >1 x 10^6 cells in 1 ml volume. HN-bs are characterized by immunofluorescence with antibodies specific to neurofilament, MAP2, and beta-tubulin III. HN-bs are negative for HIV-1, HBV, HCV, mycoplasma, bacteria, yeast and fungi. HN-bs are guaranteed to further culture in the conditions provided by Creative Bioarray.
