ONLINE INQUIRY
Human Liver S9 Fraction-200 Donors
Cat.No.: CSC-C4094X
Species: Human
Source: Liver
- Specification
- Background
- Scientific Data
- Q & A
- Customer Review
Conduct studies of metabolic stability (% of original drug remaining over time)
Identify which cytochrome P450 (CYP) enzymes oxidize a drug candidate and which UDP-glucuronosyltransferase (UGT) enzymes are responsible for glucuronidation
Identify, quantify and characterize drug metabolites
Describe a drug's metabolic pathways
Identify inhibition of cytochrome P450 (CYP) enzymes
Creative Bioarray's human liver S9 fraction-200 donors is a mixture obtained from the homogenized liver tissue of 200 healthy donors by centrifugal separation. This mixture comprises both the cytosol and microsomes extracted from the supernatant of liver cells. It contains a range of important proteins and enzymes, including microsomal proteins and soluble proteins present in the cytosol, as well as many key intracellular cofactors. The metabolic functions of this fraction are mostly explained by two major classes of metabolic enzymes. These phase I enzymes belong mostly to the cytochrome P450 (CYP450) families. Such enzyme systems are involved in the oxidation, reduction and hydrolysis of drugs, which makes the drugs extremely polar and water-soluble. The phase II metabolic enzymes include the uridine 5'-diphospho-glucuronosyltransferases (UGTs), sulfotransferases (STs), N-acetyltransferases (NATs), and glutathione S-transferases (GSTs). These enzymes then perform conjugation reactions on metabolites generated during the phase I, such as glucuronidation, sulfation, acetylation, methylation and glutathione conjugation. Thus, the S9 fraction provides a more complete and broad metabolic profile than liver microsomes alone.
Owing to its extensive donor base, HLS9-200 donors present a diverse and comprehensive enzyme profile, better representing the hepatic metabolism of the general population. Furthermore, the mixture derived from a large number of donors helps reduce the inconsistencies in experimental results caused by batch-to-batch variations between laboratories, thereby enhancing the reproducibility and comparability of the results. These make HLS9-200 donors a reliable and efficient tool in the research of drug metabolism and toxicology.
Nonspecific Binding of THC and CBD in the In Vitro Incubation Mixture and Reversibly Inhibited MPH Hydrolysis
The use of cannabis, particularly due to the presence of cannabinoids like Δ9-tetrahydrocannabinol (THC) and cannabidiol (CBD), has increased both recreationally and medically. Methylphenidate (MPH), a common attention-deficit/hyperactivity disorder (ADHD) medication, is metabolized by the liver enzyme carboxylesterase 1 (CES1), which can be inhibited by THC and CBD. Qian et al. examined the potential drug-drug interactions between MPH and cannabinoids by investigating their inhibitory effects on CES1. The objectives include characterizing the inhibition kinetics using a human liver S9 system and predicting clinical interactions through static and physiologically-based pharmacokinetic (PBPK) models.
In pure buffer, the final concentrations of THC and CBD were significantly lower than their initial amounts (Fig. 1). Concentrations increased proportionally to the amount added, suggesting solubility was not the main cause of cannabinoid loss. The nonlinear increase indicated a saturable process, likely due to nonspecific tube wall binding. In protein-containing buffer (BSA and HLS9), most added cannabinoids were recovered in the solution (Fig. 1), indicating extensive protein binding. The proposed binding model described the data well. Unbound fractions of THC and CBD in the incubation mixture (fu,inc) were calculated. For THC, with total concentrations of 1.59-31.8 μM, unbound ranged 0.0233-0.487 μM (1.5% fu,inc). For CBD, with the same range of total concentrations, unbound ranged 0.0640-1.49 μM (fu,inc approximated 4.4%). Both cannabinoids concentration-dependently inhibited MPH hydrolysis by HLS9 with reversible inhibition (Fig. 2).
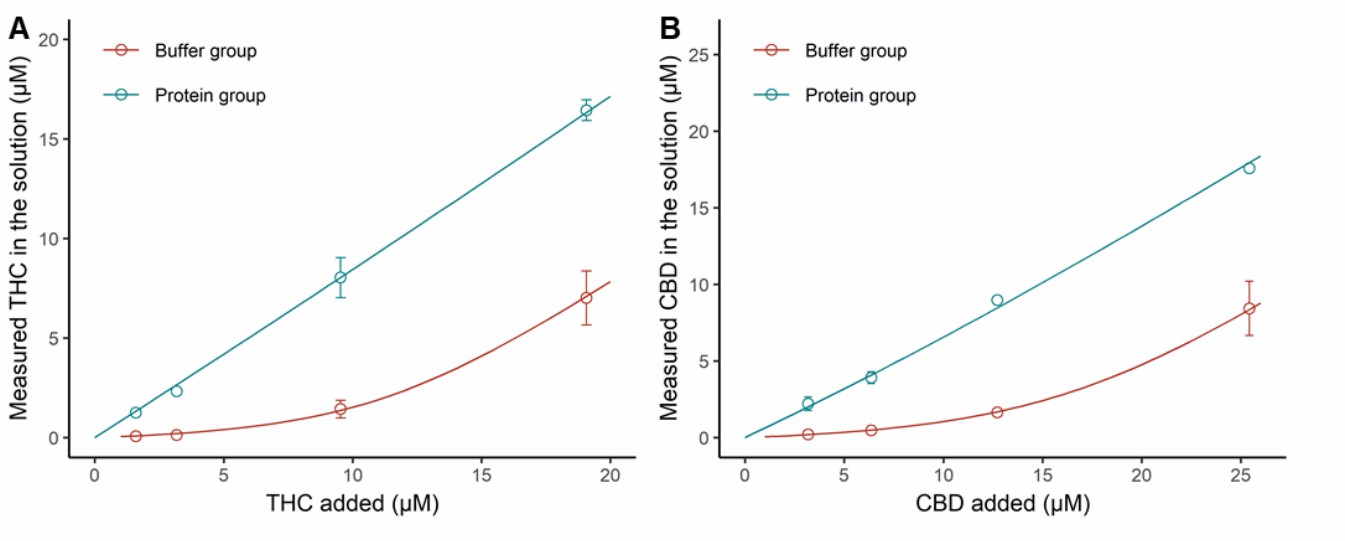 Fig. 1 Nonspecific binding of THC and CBD in the incubation mixture (BSA and HLS9) (Qian Y, Markowitz JS, et al., 2022).
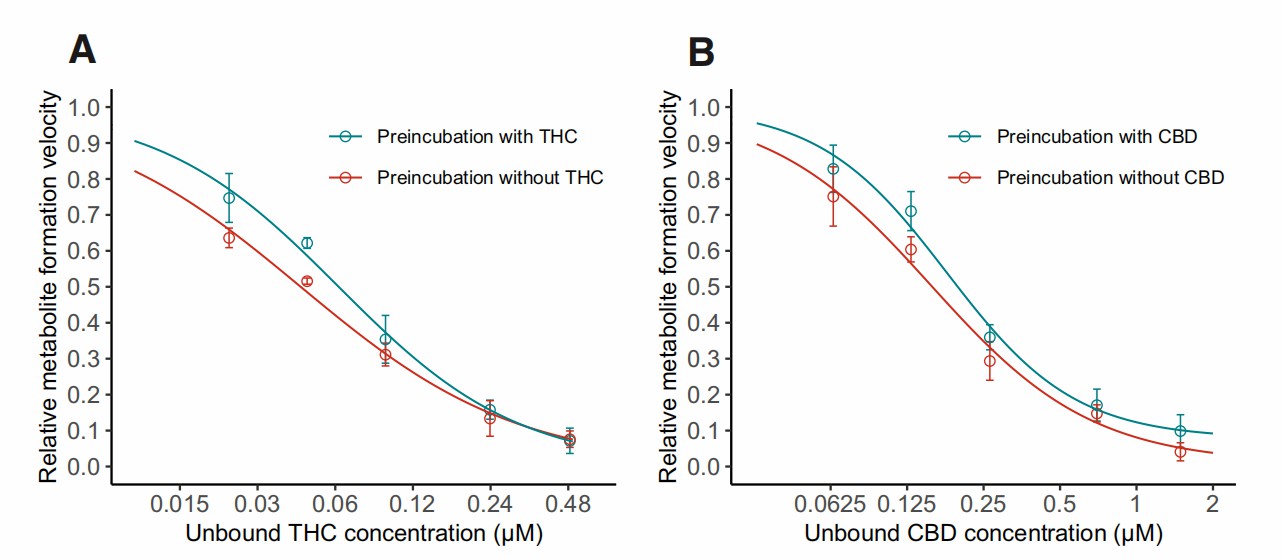 Fig. 2. Inhibition curves for THC (A) and CBD (B) in time-dependent inhibition study (Qian Y, Markowitz JS, et al., 2022).
A Comparative Study on the In Vitro Biotransformation of Medicagenic Acid Using Human Liver Microsomes and S9 Fractions
Many natural products are prodrugs that are biotransformed and activated after oral administration. In vitro screening methods can facilitate studies of gastrointestinal and hepatic biotransformation. In this study, differences in the biotransformation of medicinal acids were determined by comparing human S9 fractions with human liver microsomal and cytoplasmic fractions. Thirteen biotransformation products were identified, four of which were reported for the first time in this paper. No significant differences were observed between incubation with human liver S9 or incubation with human microsomal and cytoplasmic fractions. Therefore, both protocols applied in this study can be used to study the biotransformation reaction of human liver in vitro.
Figure 3 shows the relative abundance of metabolites. Figure 4 illustrates the in vitro metabolic pathways of medicagenic acid. The combination of microsomal and cytosolic fractions facilitates both glucuronidation and sulfation reactions, resulting in a metabolite profile qualitatively similar to that obtained using S9 fractions. This partially aligns with earlier research by Van Den Eede et al., which observed that all Phase I metabolites from HLM incubations could also be found in S9 fractions, albeit at lower concentrations. The results demonstrate quantitative differences for hydroxylated metabolites (M1-3). Metabolites M1 and M2 were more abundant in microsomal and cytosolic fractions, whereas M3 was more abundant in S9 incubations. Only minor differences in the metabolic profile were seen between different methods. For other metabolites, their relative abundance was similar across different methods. Van Den Eede et al. indicated that a higher concentration of CYP-enzymes in HLM could explain these differences. The study suggests that such differences are less pronounced for medicagenic acid, indicating minimal variance in its metabolite profile. Notably, metabolite M13 was observed only in S9 fractions incubations, suggesting that combining Phase I and II reactions might yield a more complete biotransformation profile. In contrast, M11 was seen only in microsomal and cytosolic fractions, highlighting the lower enzyme activity in S9 fractions. Given the comparable qualitative and quantitative metabolite profiles between the two models, both are suitable for in vitro hepatic biotransformation prediction. However, further studies should include other chemical classes to generalize these findings.
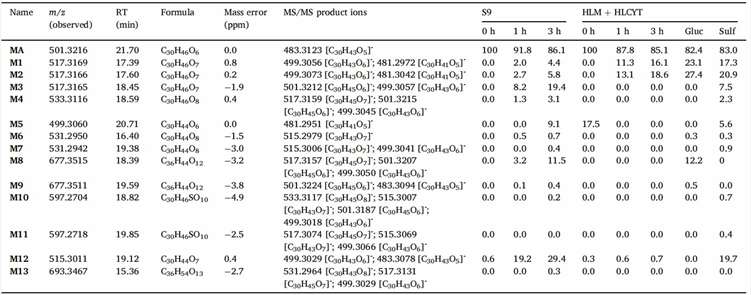 Fig. 3. Relative abundance of medicagenic acid and identified biotransformation products per incubation type (Peeters L, Vervliet P, et al., 2020).
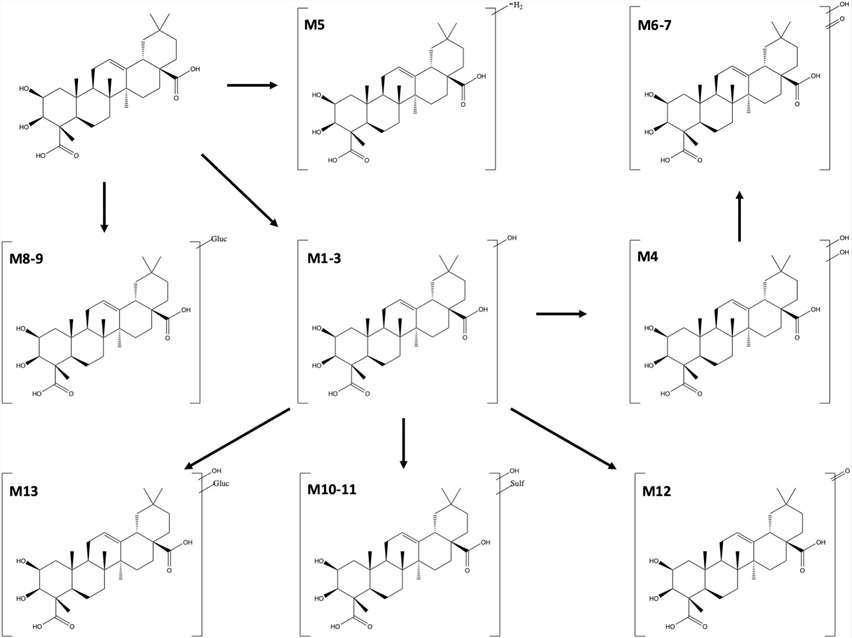 Fig. 4. Suggested in vitro hepatic biotransformation pathway of medicagenic acid (Peeters L, Vervliet P, et al., 2020).
Ask a Question
Write your own review

