Featured Products
Our Promise to You
Guaranteed product quality, expert customer support

ONLINE INQUIRY
- Specification
- Background
- Scientific Data
- Q & A
- Customer Review
The MDST8 cell line, also known as T8, is an important tool developed from human colorectal tumor explants. This cell line provides a model that closely mirrors the characteristics of human colorectal cancer, making it particularly valuable for research into tumor biology and treatment strategies. By deriving the line from tumor explants, researchers have ensured that the cells retain many of the molecular and genetic features of the original tumor, which can be critical for studying cancer progression and the effectiveness of various therapies.
One of the key applications of the MDST8 cell line is in the field of gene therapy, where it has been used in studies involving adenoviral transduction. Adenoviral vectors are commonly explored for delivering therapeutic genes directly into cancer cells. The use of MDST8 allows scientists to investigate how effectively these vectors can introduce genes into colorectal cancer cells and how these cells respond biologically. This research is fundamental for developing potential treatments aimed at manipulating gene expression to combat tumor growth and enhance sensitivity to existing therapies.
Selective Induction of MDST8 Cell Stress and Death by Everolimus and Plicamycin
Annexin V-AF647/DAPI staining revealed that MDST8 cells were selectively killed by plicamycin while presenting both early apoptotic (Annexin V-AF647+DAPI−) and necrotic (Annexin V-AF647+DAPI+) events. In contrast, MDST8 cells were resistant to the anticancer agents oxaliplatin (OXA) and sunitinib (SUN) in conditions in which a sizeable fraction of LoVo cells died (Fig. 1A-C). The differential PLI sensitivity (and SUN resistance) of CMS4 cells over CMS1 cells was confirmed for another pair of human colorectal cancer cell lines, namely, Colo320HSR and HCT116, which represent the CMS4 and CMS1 subtypes, respectively. Moreover, PLI (and to less degree EVE) induced a higher level of caspase-3 activation (measured with a fluorogenic substrate) in MDST8 than in LoVo cells (Fig. 1D, E), and PLI (and to less degree EVE) caused the release of cytochrome C from mitochondria (measured by an immunofluorescence assay that assesses the reduction of the staining intensity) more efficiently in MDST8 than in LoVo cells (Fig. 2). Moreover, MDST8 but not LoVo cells manifested an elongation of mitochondria stained with MitoTracker, as well as a reduction of MitoTracker staining. Other cellular assays confirmed the selective susceptibility of MDST8 cells to EVE and PLI as compared to LoVo cells. Thus, both EVE and PLI caused an accumulation of cells in the G0/G1 phase of the cell cycle (measured by propidium iodide staining of ethanol-permeabilized, RNase-treated cells, and cytofluorometry) with a concomitant reduction of cells in the S and G2/M phase in MDST8 but not in LoVo cells (Fig. 3A, B). Although neither EVE nor PLI induced DNA damage assessed by immunofluorescence detection of nuclear γ-histone 2 A.X foci (Fig. 3C, D), both agents caused a reduction in DNA-to-RNA transcription and RNA-to-protein translation in MDST8 but not in LoVo cells, as measured by quantifying the cellular incorporation of the RNA precursor ethacrynic uridine (EU) and the protein precursor L-azidohomoalanine (AHA), respectively (Fig. 3E-H). Finally, the autophagy-association redistribution of microtubule-associated proteins 1A/1B light chain 3B (hereafter referred to as LC3) fused to GFP (GFP-LC3), the lipidation of LC3 causing an increase in its electrophoretic mobility (annotated as LC3-II), and the decrease in the autophagic substrate sequestosome-1 (SQSTM1, best known as p62) were observed in MDST8 but not in LoVo cells cultured with EVE or PLI (Fig. 4). Altogether, these results demonstrate that MDST8 cells are sensitive to the induction of cytostatic cell stress and cell death by EVE and PLI, respectively.
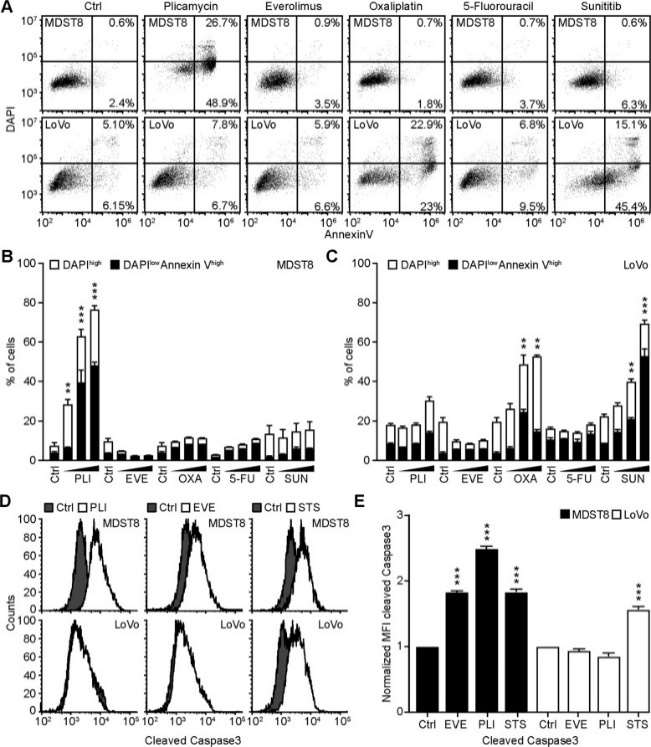 Fig. 1 Plicamycin induces cell death in MDST8. (Deng J, et al., 2021)
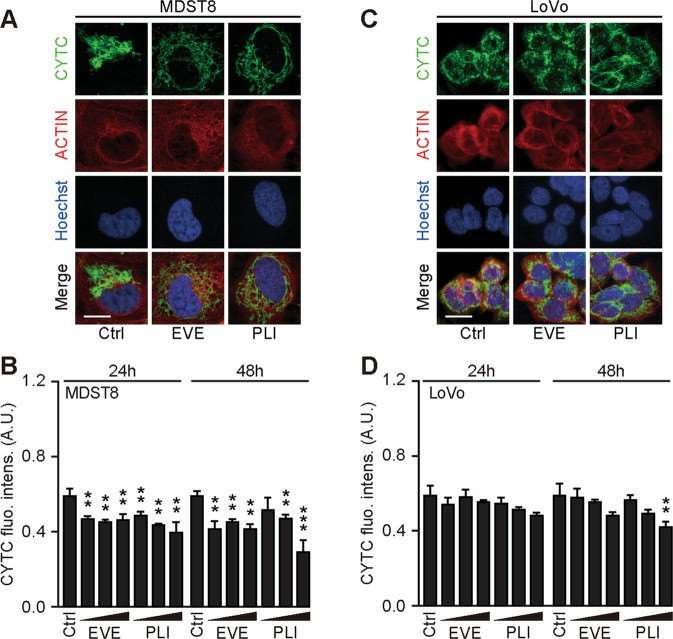 Fig. 2 Mitochondrial cytochrome c release in response to plicamycin treatment. (Deng J, et al., 2021)
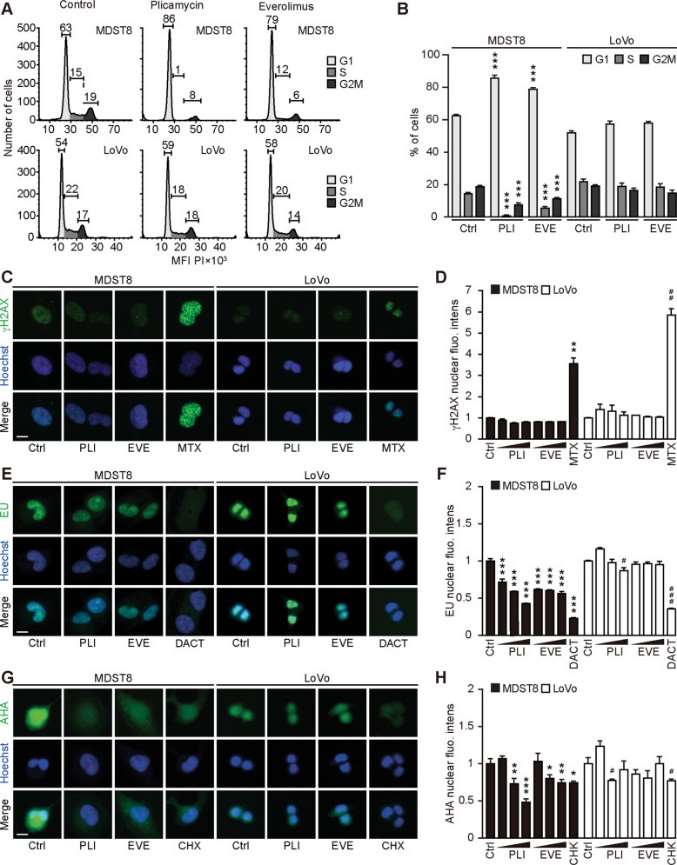 Fig. 3 Cellular stress response to everolimus and plicamycin. (Deng J, et al., 2021)
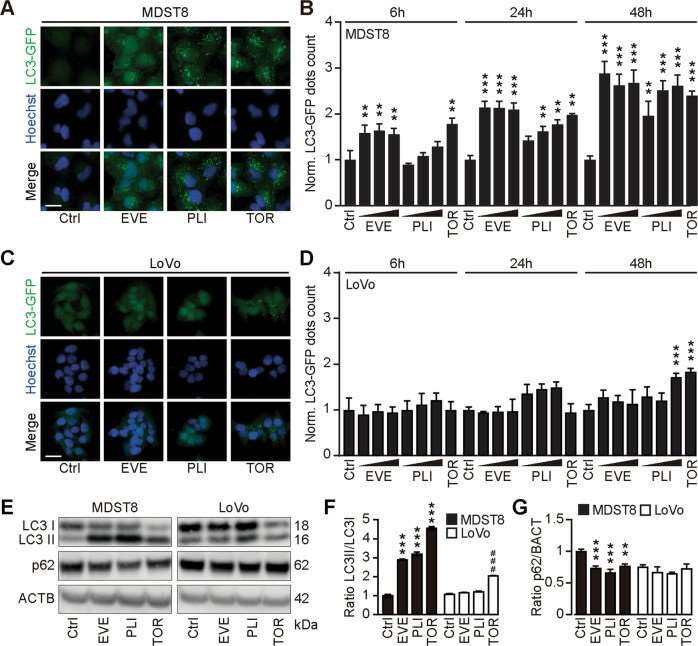 Fig. 4 Everolimus induces autophagy in MDST8. (Deng J, et al., 2021)
Effect of the CMS1 Secretome on CMS4 Migration and Invasion
The capacity of MDST8 to migrate was examined through the matrix of the basement membrane after exposure to the consensus molecular subtypes 1 (CMS 1) secretome. This was determined using transwell inserts coated with a Matrigel layer onto which MDST8 was cultured. These transwell inserts were then placed on top of HCT116 or LoVo cells. Exposure to soluble signals emanating from HCT116 or LoVo cells modestly increased MDST8 migration through the transwell membrane by 1.15 and 1.23 fold, respectively (Fig. 5a). DMSO-treated HCT116 and LoVo cells significantly increased MDST8 invasion rate by 1.64 and 1.45 fold, causing 6.82% and 16.54% MDST8 cells to cross the Matrigel barrier, respectively (Fig. 5). The invasion capacity of MDST8 was further promoted by the addition of 5-FU to the system by 16.53% (in response to HCT116 cells) and 26.53% (in response to Lovo cells) (Fig. 5). Therefore, in response to 5-FU, CMS1 cells secrete factors that promote the invasion capacity of CMS4 cells.
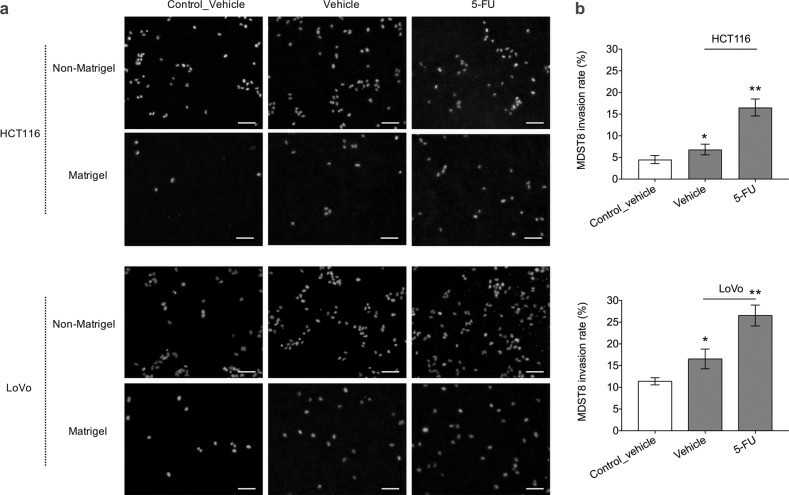 Fig. 5 MDST8 cell invasion through transwell membrane. (Källberg J, et al., 2023)
The cell recovery process should be warmed up quickly to prevent water from entering the cells during the thawing process and forming ice crystals, which can affect cell survival.
Ask a Question
Average Rating: 4.0 | 1 Scientist has reviewed this product
Friendly and knowledgeable
The customer service is friendly and knowledgeable, and I am very satisfied with their products and services.
23 Mar 2022
Ease of use
After sales services
Value for money
Write your own review

