Evolutionary Biology of Minor Gain/amp(1q) Clone Revealed by FISH
Leukemia. 2024 Jun; 38 (6): 1299-1306.
Authors: Cui J, Liu Y, Lv R, Yan W, Xu J, Li L, Du C, Yu T, Zhang S, Deng S, Sui W, Hao M, Yi S, Zou D, Qiu L, Xu Y, An G.
INTRODUCTION
Growing evidence suggests that gain or amplification [gain/amp(1q)] accumulates during disease progression of multiple myeloma (MM). Previous investigations have indicated that small gain/amp(1q) subclones present at the time of diagnosis may evolve into dominant clones upon MM relapse. However, the influence of a minor clone of gain/amp(1q) on MM survival, as well as the correlation between different clonal sizes of gain/amp(1q) and the chromosomal instability (CIN) of MM, remains poorly understood.
METHODS
Inclusion criteria required patients to meet the International Myeloma Working Group (IMWG) consensus definition of MM and to have the required FISH data, including testing for gain/amp(1q), del(1p), del(17p), del(13q), and IgH translocation.
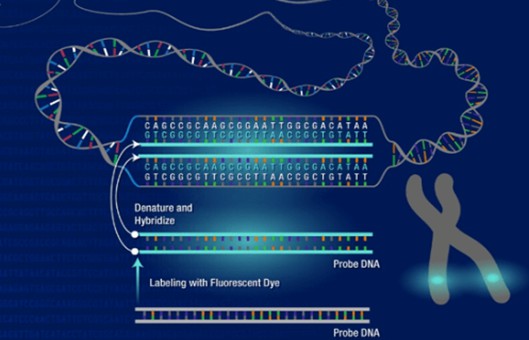
- The study uses the iFISH (interphase fluorescence in situ hybridization) technique. Bone marrow (BM) aspirate samples, anticoagulated with EDTA, were collected, and CD138+ plasma cells (PCs) were enriched using CD138+ magnetic beads, enabling a post-sorting purity higher than 90%. CAs were then analyzed on the purified PCs, and a total of 200 interphase nuclei were tested. DNA probes specific for 13q14, 17p13, and IgH dual color break-apart rearrangement probes were used. If an IgH rearrangement was found by the IgH break-apart probe, reflex testing was performed using dual-color, dual-fusion probes for t(4;14)(p16;q32), t(11;14)(q13;q32), t(14;16)(q32;q23) and t(14;20)(q32;q12) to identify the translocation partner. And the Cytocell dual-color CKS1B/CDKN2C probe was used for detecting gain/amp(1q) and del(1p).
- According to our previous ROC analyses, the cutoff values for del(17p), gain/amp(1q), and del(13q) were set at 50%, 20%, and 10%, respectively. For del(1p) and IgH translocations, the positivity threshold was 10%. Furthermore, the mean + 3 standard deviations of gain/amp(1q) calculated from the normal control is 2.12% in our center, and this value is set as our in-house established technical cutoff. A minor clone of gain/amp(1q) or gain/amp(1q) ≤ 20% is defined as the detection of gain/amp(1q) in purified PCs exceeding 2.12% but not exceeding 20%.
- Browse our recommendations
| Product/Service Types | Description |
| Probe | Creative Bioarray provides the most comprehensive list of FISH probes for rapid identification of a wide range of chromosomal aberrations across the genome. |
| Fluorescent In Situ Hybridization (FISH) Service | Creative Bioarray offers a range of different FISH services, including metaphase and interphase FISH (chromosomal assignment and clone ordering), fibre-FISH (chromosome painting), RNA-FISH (cell-based gene expression assay), M-FISH (multicolor karyotyping), 3D-FISH (on three-dimensionally preserved nuclei), flow-FISH (quantify the length of telomeres), immunoFISH (combined FISH and IHC). |
RESULTS
- To provide further insights into the characteristics of clonal size and copy number of gain/amp(1q) and their relationship, we initially grouped the patients into three categories based on the copy number of 1q: three copies, four copies, and five or more copies. The median clonal sizes of gain/amp(1q) for these groups were 71%, 78%, and 83.5%, respectively. Notably, significantly higher clonal sizes were observed in patients with five or more copies or four copies of 1q compared to those with three copies of 1q (Fig. 1A). Subsequently, we applied cutoff values of 20% and 50% to categorize the clonal size of gain/amp(1q) into minor (≤20%), subclonal (20-50%), and dominant (>50%) clones. In our cohort, 55, 76, and 382 NDMM patients were identified with a minor, subclonal, and dominant clone of gain/amp(1q), respectively (Fig. 1B).
- Similar copy number architecture between patients with a minor clone and those with a dominant or subclonal clone of gain/amp(1q) (Fig. 1C). Further analyses revealed that progressively higher numbers of CAs were detected in patients without gain/amp(1q) and in those with a minor, subclonal, and dominant clone of gain/amp(1q). For patients without gain/amp(1q), with a minor, subclonal, and dominant clone of gain/amp(1q), at least one CA was detected in 65%, 73%, 83%, and 88% of them, respectively (Fig. 1D). Moreover, for patients with no gain/amp(1q) and with a minor clone of gain/amp(1q), 18% and 22%, respectively, had at least one high-risk CA, while for patients with a subclonal and a dominant clone of gain/amp(1q), 27% and 43% of patients were detected with at least one high-risk CA at the time of diagnosis, respectively (Fig. 1E).
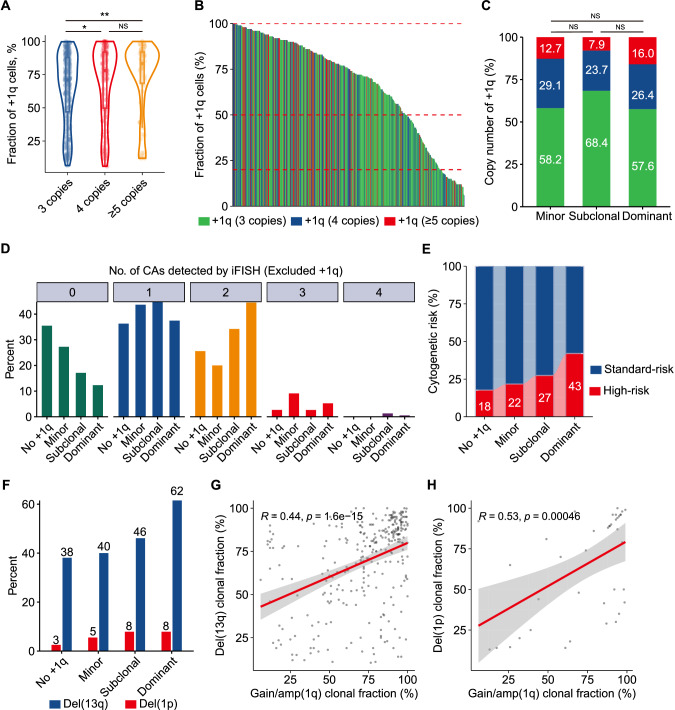 Fig. 1 Copy number and clonal size evolution of gain/amp(1q) and its relationship with CIN phenotype in MM.
- We hypothesized that there might be a subset of patients with a minor clone of gain/amp(1q) who had worse survival due to concomitant high-risk genetic factors. To investigate this, we initially compared the survival outcomes of patients with both a minor clone of gain/amp(1q) and at least two CAs (other than gain/amp(1q)) to those with a minor clone of gain/amp(1q) and fewer than two CAs. Despite similar PFS between these two groups (+1q ≤ 20% &<2 CAs: 52.9 months vs. +1q ≤ 20% & ≥2 CAs: 33.7 months, P = 0.370) (Fig. 2A), patients with +1q ≤ 20% & ≥2 CAs experienced significantly shorter OS than those with +1q ≤ 20% & <2 CAs (+1q ≤ 20% & <2 CAs: 71.6 months vs. +1q ≤ 20% & ≥2 CAs: 40.6 months, P = 0.035) (Fig. 2B). Further analysis revealed significantly shorter PFS and OS in patients with concomitant del(1p) and a minor clone of gain/amp(1q) compared to those with a minor clone of gain/amp(1q) and without del(1p) (PFS: +1q ≤ 20% & no del(1p): 52.2 months vs. +1q ≤ 20% & del(1p): 13.4 months, P < 0.001; OS: +1q ≤ 20% & no del(1p): 71.6 months vs. +1q ≤ 20% & del(1p): 33.6 months, P < 0.001) (Fig. 2C, D). Although a minor clone of gain/amp(1q) was not inherently associated with a poor prognosis in MM, the coexistence of more than two CAs in a subset of patients with a minor clone of gain/amp(1q) might lead to a poor prognosis in this specific group of patients.
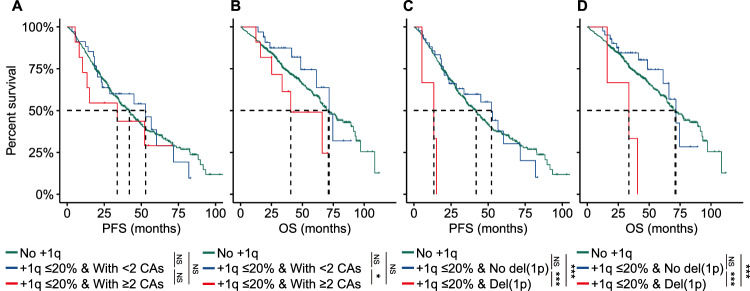 Fig. 2 Concomitant del(1p) and minor clone of gain/amp(1q) are associated with a poor clinical outcome in MM.
- We delved into the clonal evolution of the minor clone of gain/amp(1q) by conducting longitudinal FISH examinations at diagnosis and relapse. In our cohort, 13 patients with a minor clone of gain/amp(1q) at diagnosis underwent FISH testing at their first relapse. Our results indicated that nine cases (69%) saw the evolution of the minor clone at diagnosis into a subclonal/dominant clone at first relapse, while two patients (15%) maintained a minor clone of gain/amp(1q) both at diagnosis and relapse. Only two patients (15%) experienced the loss of the minor clone of gain/amp(1q) at relapse (Fig. 3A). Further analysis revealed that the clonal evolution of the minor clone of gain/amp(1q) was accompanied by an expanded clonal size of del (17) or by newly acquired del(17p) (Fig. 3B). Finally, patients with a significant increase in the clonal size of gain/amp(1q) had significantly shorter PFS than patients with a subclonal and a dominant clone of del(1q) at diagnosis (Fig. 3C), while no significant differences were observed for OS among these groups. A minor clone of gain/amp(1q) was prone to evolve into a dominant clone at relapse and was also correlated with the clonal evolution of del(17p).
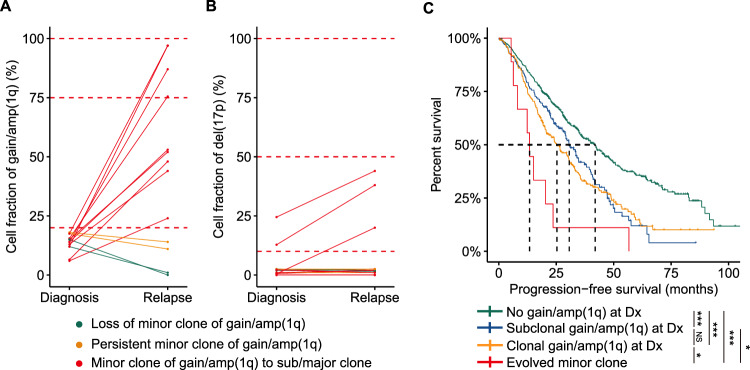 Fig. 3 Clonal evolution of minor clone of gain/amp(1q).
SUMMARY
A significant increase in the clonal size of the minor clone of gain/amp(1q) is frequently observed in MM. These findings suggested that a minor clone of gain/amp(1q) might represent an earlier stage in the pathogenesis of gain/amp(1q) and propose a "two-step" process in the clonal size changes of gain/amp(1q) in MM.
RELATED PRODUCTS & SERVICES
Reference
- Cui J, et al. (2024). "Fluorescence in situ hybridization reveals the evolutionary biology of the minor clone of gain/amp(1q) in multiple myeloma." Leukemia. 38 (6): 1299-1306.