- You are here: Home
- Disease Models
- Cardiovascular Disease Models
- Venous Thrombosis Model
- Inferior Vena Cava (IVC) Stenosis Model
Disease Models
- Oncology Models
-
Inflammation & Autoimmune Disease Models
- Rheumatoid Arthritis Models
- Glomerulonephritis Models
- Multiple Sclerosis (MS) Models
- Ocular Inflammation Models
- Sjögren's Syndrome Model
- LPS-induced Acute Lung Injury Model
- Peritonitis Models
- Passive Cutaneous Anaphylaxis Model
- Delayed-Type Hypersensitivity (DTH) Models
- Inflammatory Bowel Disease Models
- Systemic Lupus Erythematosus Animal Models
- Asthma Model
- Sepsis Model
- Psoriasis Model
- Atopic Dermatitis (AD) Model
- Scleroderma Model
- Gouty Arthritis Model
- Carrageenan-Induced Air Pouch Synovitis Model
- Carrageenan-Induced Paw Edema Model
- Experimental Autoimmune Myasthenia Gravis (EAMG) Model
-
Cardiovascular Disease Models
- Surgical Models
- Animal Models of Hypertension
- Venous Thrombosis Model
- Atherosclerosis model
- Cardiac Arrhythmia Model
- Hyperlipoidemia Model
- Doxorubicin-induced Heart Failure Model
- Isoproterenol-induced Heart Failure Model
- Arterial Thrombosis Model
- Pulmonary Arterial Hypertension (PAH) Models
- Heart Failure with Preserved Ejection Fraction (HFpEF) Model
-
Neurological Disease Models
- Alzheimer's Disease Modeling and Assays
- Seizure Models
- Parkinson's Disease Models
- Ischemic Stroke Models
- Acute Spinal Cord Injury (ASCI) Model
- Traumatic Brain Injury (TBI) Model
- Hypoxic-Ischemic Encephalopathy (HIE) Model
- Tourette Syndrome (TS) Model
- Amyotrophic Lateral Sclerosis (ALS) Model
- Huntington's Disease (HD) Model
- Intracerebral hemorrhage (ICH) Models
- Pain Models
- Metabolic Disease Models
- Liver Disease Models
- Rare Disease Models
- Respiratory Disease Models
- Digestive Disease Models
-
Urology Disease Models
- Cisplatin-induced Nephrotoxicity Model
- Unilateral Ureteral Obstruction Model
- 5/6 Nephrectomy Model
- Renal Ischemia-Reperfusion Injury (RIRI) Model
- Diabetic Nephropathy (DN) Models
- Passive Heymann Nephritis (PHN) Model
- Adenine-Induced Chronic Kidney Disease (CKD) Model
- Kidney Stone Model
- Doxorubicin-Induced Nephropathy Model
- Orthopedic Disease Models
- Ocular Disease Models
- Skin Disease Models
- Infectious Disease Models
Inferior Vena Cava (IVC) Stenosis Model
Creative Bioarray provides preclinical evaluation of drug candidates that are useful for the treatment of venous thrombosis. One of our cutting-edge tools is our inferior vena cava (IVC) stenosis model, which accurately simulates the conditions of venous thrombosis. This model allows us to evaluate your drug candidates under realistic physiological conditions, providing invaluable insights into their therapeutic potential.
Deep vein thrombosis (DVT), characterized by the formation of blood clots in the deep veins, predominantly in the legs, represents a significant health and economic concern. Pulmonary embolism (PE), a potentially fatal complication of DVT, arises when a thrombus detaches and travels to the lungs, potentially causing respiratory insufficiency or even death.
To gain insights into the mechanisms underlying thrombus formation in DVT, researchers have developed various models. Among these, the Inferior vena cava (IVC) stenosis model stands out for its ability to mimic thrombus development in humans while minimizing vessel wall injury. In contrast to the stasis model, the IVC stenosis model preserves venous blood flow, allowing for a more realistic simulation of thrombus formation. The likely mechanism of thrombus formation in this model is linked to endothelial activation, reduced blood flow velocity, and disturbed blood flow patterns upstream of the stenosis site.
Our Inferior Vena Cava (IVC) Stenosis Model
- Available Animal
Rat
- Modeling Method
After anesthesia is administered, a meticulous dissection is performed on the IVC to separate it from the adjacent tissue. A sterile spacer is placed on the exposed IVC, followed by passing a ligature that loops around the IVC and the spacer. The spacer and the IVC are ligated immediately distal to the renal veins, followed by the removal of the spacer, which will decrease venous blood flow by around 90%.
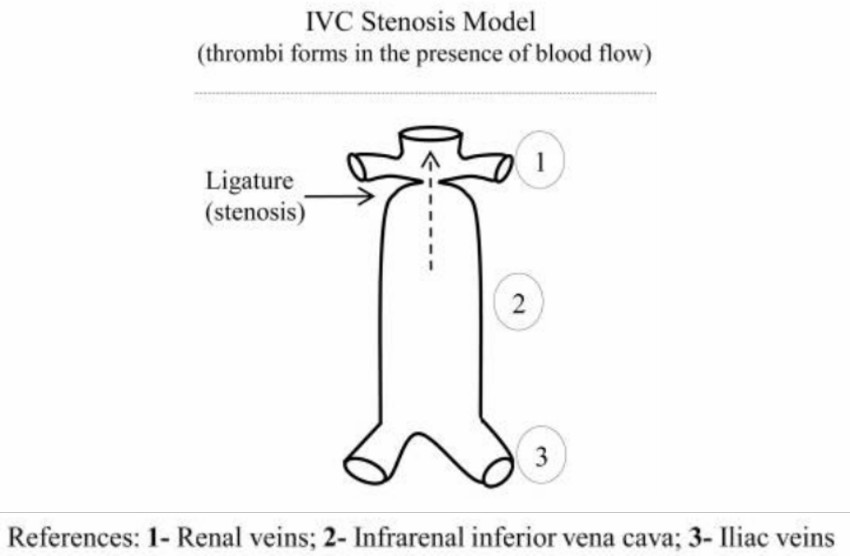 Fig. 1 Schematic representation of stenosis inferior vena cava (IVC) model. (Diaz et al. 2012)
- Endpoints
- Weight of thrombus
- Length of thrombus
- Inflammatory cytokine analysis
- Biomarker analysis: D-dimer, etc.
- Histology analysis
- qPCR or Western blot
- Other customized endpoints
Example Data
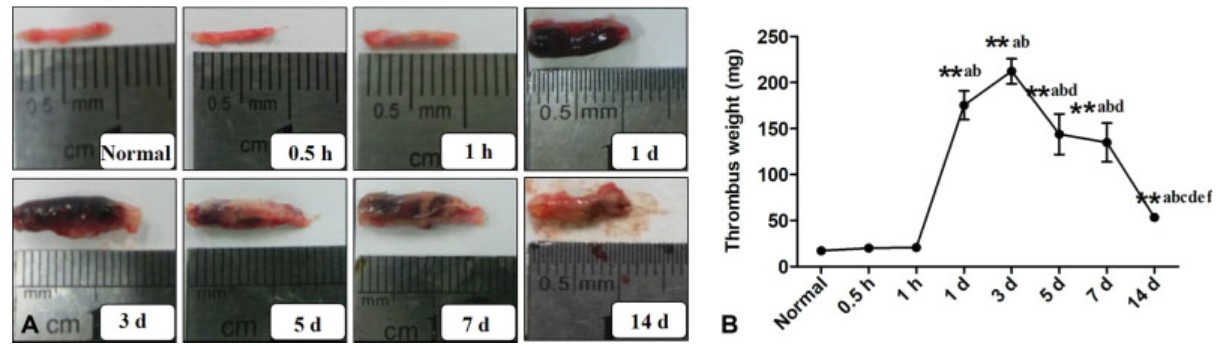 Fig. 2 Deep vein thrombosis (DVT) was induced by inferior vena cava (IVC) stenosis in Sprague-Dawley (SD) rats. At different time points after surgical operation, IVCs were harvested and weighed. One representative IVC of each group (A) and thrombus weight (B) are shown. (Yao et al. 2019)
Meanwhile, we also provide other thrombosis models that maybe you are interested in:
Quotation and Ordering
Creative Bioarray offers a range of services that have the benefit of personalized experimental designs, expert scientific guidance, and consultancy. Additionally, we can create new models and assays to meet the specific requirements of our clients. If you are interested in our services, please do not hesitate to contact us at any time or submit an inquiry to us directly.
References
- Diaz, J.A., et al. Critical review of mouse models of venous thrombosis. Arterioscler Thromb Vasc Biol, 2012;32(3):556-562.
- Albadawi, H., et al. Animal models of venous thrombosis. Cardiovasc Diagn Ther, 2017;7(Suppl 3): S197-S206. doi:10.21037/cdt.2017.08.10
- Yao, X., et al. Deep Vein Thrombosis is Modulated by Inflammation Regulated via Sirtuin 1/NF-κB Signalling Pathway in a Rat Model. Thromb Haemost, 2019;119(3):421-430.
- Payne, H., Brill, A. Stenosis of the Inferior Vena Cava: A Murine Model of Deep Vein Thrombosis. J Vis Exp, 2017;(130):56697.
For research use only. Not for any other purpose.
