- You are here: Home
- Disease Models
- Cardiovascular Disease Models
- Venous Thrombosis Model
- Inferior Vena Cava (IVC) Stasis/Ligation Model
Disease Models
- Oncology Models
-
Inflammation & Autoimmune Disease Models
- Rheumatoid Arthritis Models
- Glomerulonephritis Models
- Multiple Sclerosis (MS) Models
- Ocular Inflammation Models
- Sjögren's Syndrome Model
- LPS-induced Acute Lung Injury Model
- Peritonitis Models
- Passive Cutaneous Anaphylaxis Model
- Delayed-Type Hypersensitivity (DTH) Models
- Inflammatory Bowel Disease Models
- Systemic Lupus Erythematosus Animal Models
- Asthma Model
- Sepsis Model
- Psoriasis Model
- Atopic Dermatitis (AD) Model
- Scleroderma Model
- Gouty Arthritis Model
- Carrageenan-Induced Air Pouch Synovitis Model
- Carrageenan-Induced Paw Edema Model
- Experimental Autoimmune Myasthenia Gravis (EAMG) Model
-
Cardiovascular Disease Models
- Surgical Models
- Animal Models of Hypertension
- Venous Thrombosis Model
- Atherosclerosis model
- Cardiac Arrhythmia Model
- Hyperlipoidemia Model
- Doxorubicin-induced Heart Failure Model
- Isoproterenol-induced Heart Failure Model
- Arterial Thrombosis Model
- Pulmonary Arterial Hypertension (PAH) Models
- Heart Failure with Preserved Ejection Fraction (HFpEF) Model
-
Neurological Disease Models
- Alzheimer's Disease Modeling and Assays
- Seizure Models
- Parkinson's Disease Models
- Ischemic Stroke Models
- Acute Spinal Cord Injury (ASCI) Model
- Traumatic Brain Injury (TBI) Model
- Hypoxic-Ischemic Encephalopathy (HIE) Model
- Tourette Syndrome (TS) Model
- Amyotrophic Lateral Sclerosis (ALS) Model
- Huntington's Disease (HD) Model
- Intracerebral hemorrhage (ICH) Models
- Pain Models
- Metabolic Disease Models
- Liver Disease Models
- Rare Disease Models
- Respiratory Disease Models
- Digestive Disease Models
-
Urology Disease Models
- Cisplatin-induced Nephrotoxicity Model
- Unilateral Ureteral Obstruction Model
- 5/6 Nephrectomy Model
- Renal Ischemia-Reperfusion Injury (RIRI) Model
- Diabetic Nephropathy (DN) Models
- Passive Heymann Nephritis (PHN) Model
- Adenine-Induced Chronic Kidney Disease (CKD) Model
- Kidney Stone Model
- Doxorubicin-Induced Nephropathy Model
- Orthopedic Disease Models
- Ocular Disease Models
- Skin Disease Models
- Infectious Disease Models
Inferior Vena Cava (IVC) Stasis/Ligation Model
Creative Bioarray is a pioneering organization that specializes in the field of cardiovascular diseases. Our team of experts conducts rigorous and comprehensive efficacy studies using the inferior vena cava (IVC) stasis/ligation model to evaluate potential therapeutic interventions for a wide range of cardiovascular conditions. Through this model, we aim to advance the understanding of disease mechanisms and contribute to the development of effective treatments.
Deep vein thrombosis (DVT) and its fatal complication, pulmonary embolism, constitute a grave health hazard with significant mortality rates. To devise more effective and targeted therapies, a profound understanding of DVT pathogenesis is imperative. To this end, numerous animal models of venous thrombosis have been established in both small and large animals. Prominently among these, the inferior vena cava stasis model emerges as an invaluable resource. The mechanism underlying thrombus formation in this model closely resembles the interplay between venous stasis and the enhanced local release of tissue factor, leading to augmented coagulation within the vein. This model offers a robust platform for investigating DVT pathogenesis and evaluating potential therapeutic interventions.
Our Inferior Vena Cava (IVC) Stasis/Ligation Model
- Available Animal
Rat
- Modeling Method
After anesthesia is administered, a meticulous dissection is performed on the inferior vena cava to separate it from the adjacent tissue. Subsequently, the vena cava, along with all of its side branches, is meticulously ligated to ensure complete occlusion of blood flow.
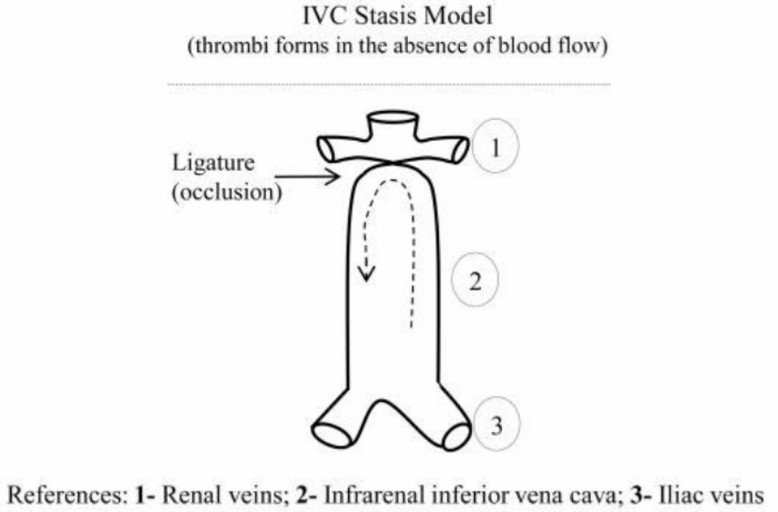 Fig. 1 Schematic representation of ligation IVC model. (Diaz et al. 2012)
- Endpoints
- Weight of thrombus
- Length of thrombus
- Biomarker analysis
- Histology analysis
- qPCR or Western blot
- Other customized endpoints
Example Data
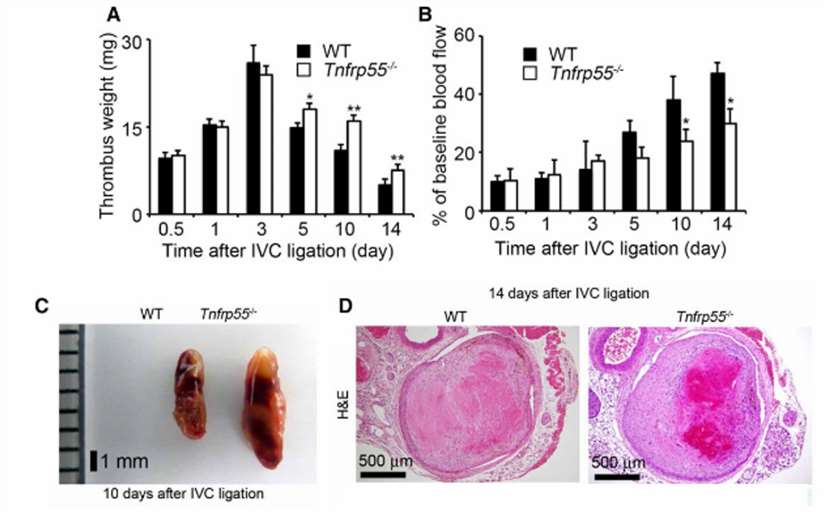 Fig. 2 Inferior vena cava (IVC) ligation–induced deep vein thrombus in wild-type (WT) and Tnfrp55-/- mice. A, Thrombus weights of WT and Tnfrp55-/- mice at the indicated time intervals after IVC ligation. B, The measurement of IVC blood flow by laser Doppler imaging. C, Macroscopic appearance of venous thrombi in WT and Tnfrp55-/- mice at 10 d after the IVC ligation. D, H&E staining of venous thrombi obtained from WT and Tnfrp55-/- mice at 14 d after the IVC ligation. (Nosaka et al. 208)
In addition, we also provide other thrombosis models that maybe you are interested in:
Quotation and Ordering
Creative Bioarray offers highly efficient preclinical services that are cost-effective and time-saving. Our team of experienced scientists is dedicated to assisting clients in selecting the most appropriate model and customizing study protocols to achieve optimal results using minimal resources. If you are interested in our services, please feel free to contact us at any time or submit an inquiry to us directly.
References
- Wrobleski, S.K., et al. Mouse complete stasis model of inferior vena cava thrombosis. J Vis Exp, 2011;(52):2738.
- Albadawi, H., et al. Animal models of venous thrombosis. Cardiovasc Diagn Ther, 2017;7(Suppl 3): S197-S206.
- Nosaka, M., et al. Contribution of the TNF-α (Tumor Necrosis Factor-α)–TNF-Rp55 (Tumor Necrosis Factor Receptor p55) axis in the resolution of venous thrombus. Arteriosclerosis, thrombosis, and vascular biology, 2018, 38(11): 2638-2650.
- Diaz, J.A., et al. Critical review of mouse models of venous thrombosis. Arterioscler Thromb Vasc Biol, 2012;32(3):556-562.
For research use only. Not for any other purpose.
