Featured Products
Our Promise to You
Guaranteed product quality, expert customer support

ONLINE INQUIRY
Calu-3
Cat.No.: CSC-C9348L
Species: Homo sapiens (human)
Morphology: Epithelial
Culture Properties: Adherent
- Specification
- Background
- Scientific Data
- Q & A
- Customer Review
CSF1PO: 11,12
D13S317: 12
D16S539: 12,14
D5S818: 11
D7S820: 10,11
THO1: 6,9.3
TPOX: 8
vWA: 16,17
Shipping Condition: Room Temperature
The Calu-3 cell line is derived from a 25-year-old Caucasian male patient with lung adenocarcinoma. Established in the early 1990s, Calu-3 cells are notable for their tumorigenic properties, making them a valuable model for studying lung cancer biology. The patient from whom the cell line was derived had previously undergone chemotherapy treatment with agents such as Cytoxan (cyclophosphamide), bleomycin, and adriamycin (doxorubicin). This background highlights the relevance of Calu-3 cells in understanding the impacts of prior therapies on tumor characteristics and treatment responses.
Calu-3 cells are characterized by their ability to form well-differentiated grade I adenocarcinomas when implanted in immunodeficient nude mice. This tumorigenic capability allows researchers to explore the progression of lung adenocarcinoma in vivo, providing insights into tumor morphology, growth patterns, and the interaction between cancer cells and the host immune environment. The well-differentiated nature of the tumors formed by Calu-3 cells suggests that they retain certain functional characteristics of normal lung epithelial cells, which is crucial for studying differentiation and function in lung cancer.
In addition to their use in tumorigenicity studies, Calu-3 cells serve as an important tool for drug testing and development. Their responsiveness to various chemotherapeutic agents and targeted therapies provides a platform for evaluating the efficacy of new treatments. Researchers often utilize Calu-3 to investigate mechanisms of drug resistance, cell signaling pathways, and potential therapeutic combinations.
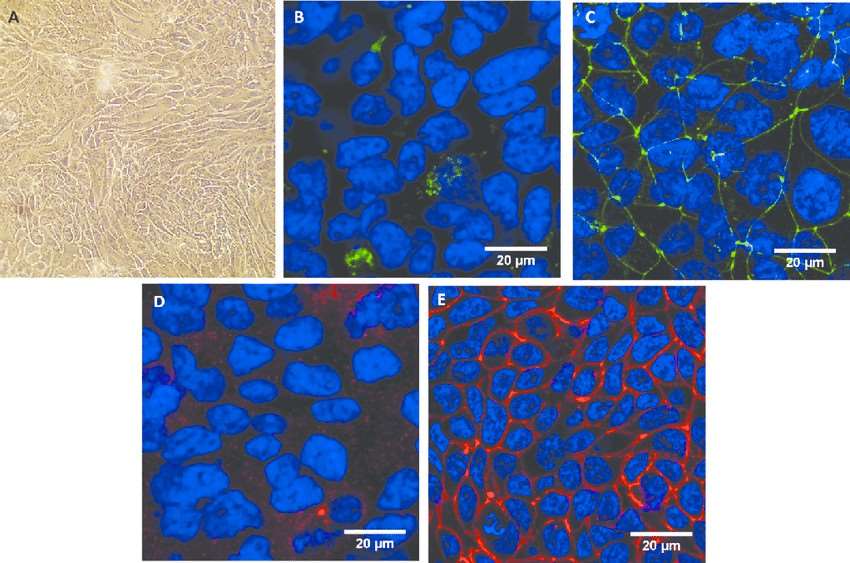 Fig. 1 Morphological characterization of the Calu-3 epithelium. (George I, et al., 2015)
ACE2 Expression Levels in Calu-3 Cells Grown in High D-Glucose Medium
Angiotensin-converting enzyme 2 (ACE2) is a carboxypeptidase that negatively regulates the renin-angiotensin system, which can induce vasodilation by cleaving a single residue from the inactive decapeptide angiotensin I to generate angiotensin and degrade angiotensin II. The time dependency of ACE2 mRNA expression was investigated in Calu-3 cells; the cells were treated with normal D-glucose (NG) or high D-glucose (HG) for 24, 48, and 72 h. Real-time quantitative polymerase chain reaction (qPCR) was used to determine ACE2 mRNA expression levels. ACE2 mRNA expression levels in HG-treated cells were not significantly different from those in NG-treated cells at 24 h. However, ACE2 mRNA expression in HG-treated cells was significantly elevated at 48 and 72 h (p < 0.05, Fig. 2a). Further, dose-titration of D-glucose was performed in Calu-3 cells at 72 h. The cells were treated with different D-glucose concentrations [100 (NG), 325, 550, 1000 (HG), and 5000 mg/dL]. Interestingly, ACE2 mRNA expression was significantly enhanced with 550, 1000, and 5000 mg/dL D-glucose treatments, but not with NG treatment (p < 0.05). Additionally, lower D-glucose concentrations did not enhance ACE2 mRNA expression (Fig. 2b). To determine ACE2 protein expression levels after NG or HG treatment, western blotting of cell lysates was performed after 24, 48, and 72 h of treatment. Protein expression levels in HG-treated cells were elevated compared with those in NG-treated cells at 24, 48, and 72 h (Fig. 3a and b).
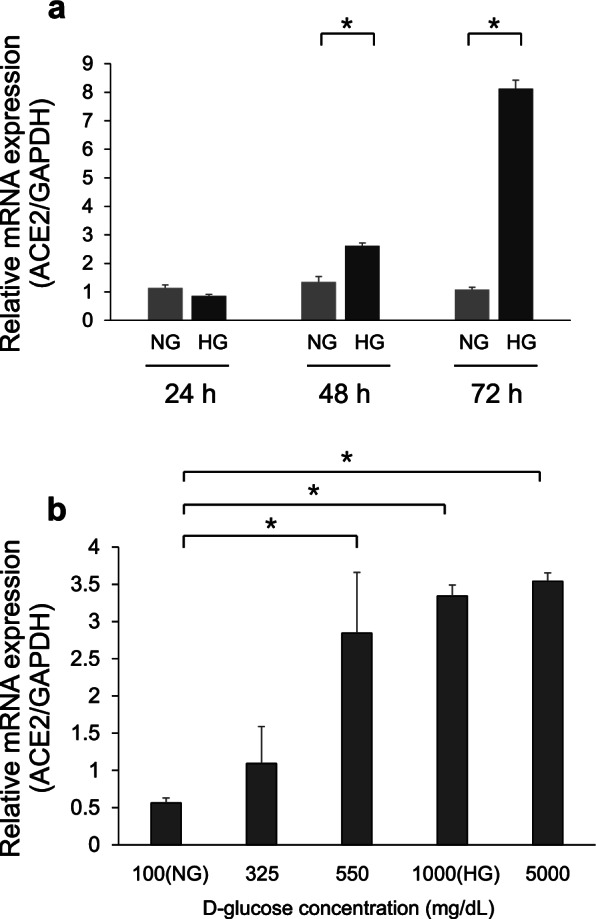 Fig. 2 Real-time quantitative polymerase chain reaction analysis of angiotensin-converting enzyme 2 (ACE2) mRNA expression. (Wakabayashi Y, et al., 2022)
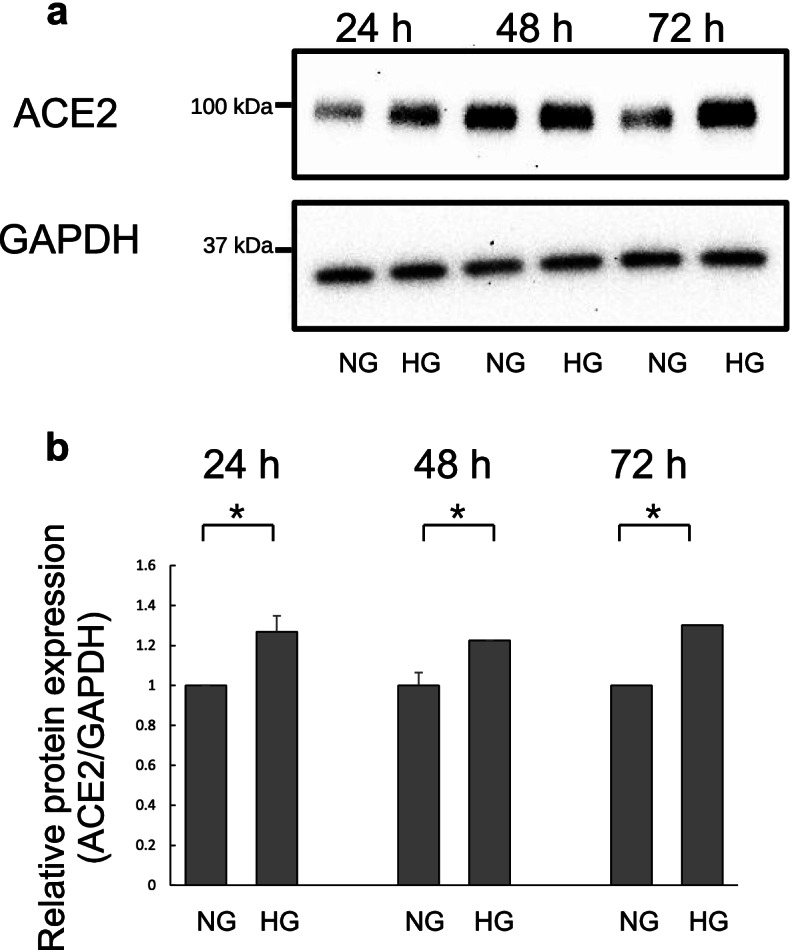 Fig. 3 Western blot analysis of angiotensin-converting enzyme 2 (ACE2) expression in Calu-3 cells. (Wakabayashi Y, et al., 2022)
SARS-CoV-2 Infection Induces MUC1-C Expression in Calu-3 Cells
Severe acute respiratory syndrome coronavirus 2 (SARS-CoV-2) is a lineage B betacoronavirus that is responsible for the current coronavirus disease 2019 (COVID-19) pandemic. Many COVID-19 patients have difficulty breathing partially due to excessive mucus formation. As MUC1 is a major constituent of the mucus layer in the respiratory system, the impact of SARS-CoV-2 infection on MUC1 expression was investigated in Calu-3 cells using an antibody that recognizes the intracellular C-terminal region of MUC1. As controls, Calu-3 cells were cultured without infection (mock infection). MUC1-C expression was slightly elevated during culture in mock-infected cells and was markedly induced by SARS-CoV-2 (Fig. 4A). Specifically, SARS-CoV-2 infection promptly induced MUC1-C expression at 12 h. Moreover, SARS-CoV-2-induced MUC1-C expression continued to rise to 24 h and was maintained at peak levels until 72 h. As β-catenin is one of the known downstream targets activated by MUC1, expression levels of β-catenin. However, no differences were observed between SARS-CoV-2 and mock infections. In addition to its role in the cell membrane, MUC1-C can function as an oncogene by translocating to the nucleus to activate transcription. To determine if MUC1-C was imported to the nucleus after SARS-CoV-2 infection, Calu-3 cells were treated with Leptomycin B to inhibit nuclear export. A small proportion of MUC1-C was present in nuclei after SARS-CoV-2 infection (Fig. 4B). In contrast, no MUC1-C signal was observed in the nuclei of uninfected control cells. These results suggest that MUC1-C signaling activity is substantially altered in Calu-3 cells after SARS-CoV-2 infection.
SARS-CoV-2 infection induces STAT3 phosphorylation in Calu-3 cells, and others have demonstrated that STAT3 influences MUC1 expression in lung cancer cells. Therefore, the effect of STAT3 inhibitors, including AG490, JAK inhibitor I, and S3I-201, on MUC1-C expression. In mock-infected Calu-3 cells, basal expression of MUC1-C was reduced by treatment with JAK inhibitor I but not by treatment with AG490 or S3I-201. Importantly, JAK inhibitor I also markedly reduced MUC1-C expression in SARS-CoV-2-infected Calu-3 cells (Fig. 4C). These results support that increased MUC1 expression after SARS-CoV-2 infection is dependent on JAK1/3 activation and subsequent STAT3 activation.
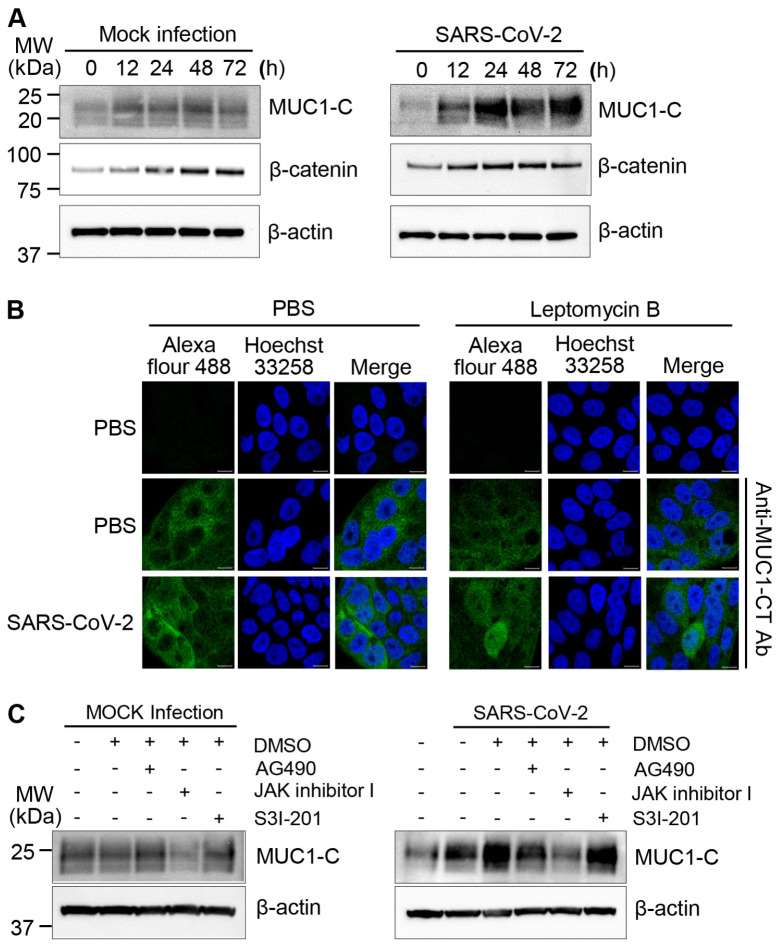 Fig. 4 MUC1-C expression in SARS-CoV-2-infected Calu-3 cells. (Kim D, et al., 2021)
The MTT assay is used to determine the cellular viability or metabolic activity in microcapsules. It is based on the ability of metabolically active cells to transform a water-soluble dye[3-(4,5-dimethylthiazol-2-yl)-2,5-diphenyltetrazolium bromide] into an insoluble formazan.
Ask a Question
Average Rating: 4.0 | 1 Scientist has reviewed this product
Prompt support
Creative Bioarray provided prompt customer support and ensured a smooth delivery process.
23 May 2023
Ease of use
After sales services
Value for money
Write your own review
- You May Also Need

