Featured Products
Our Promise to You
Guaranteed product quality, expert customer support

ONLINE INQUIRY
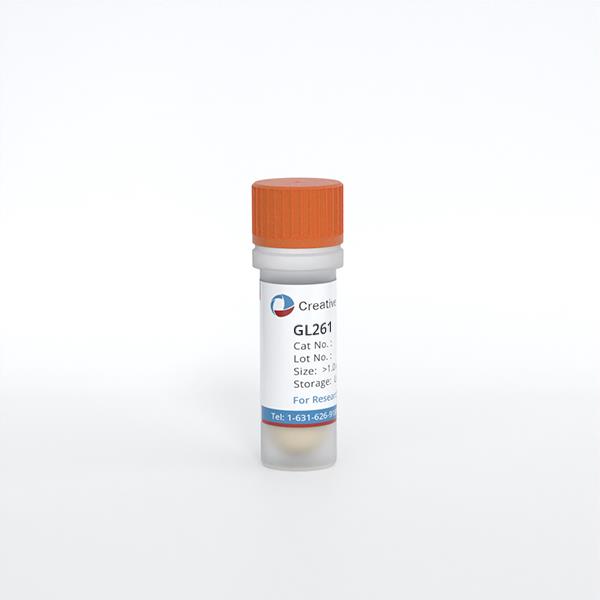
GL261
Cat.No.: CSC-C9184W
Species: Mouse
Source: glioblastoma
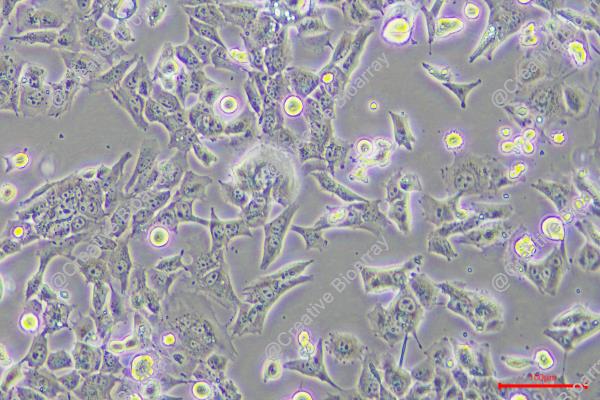
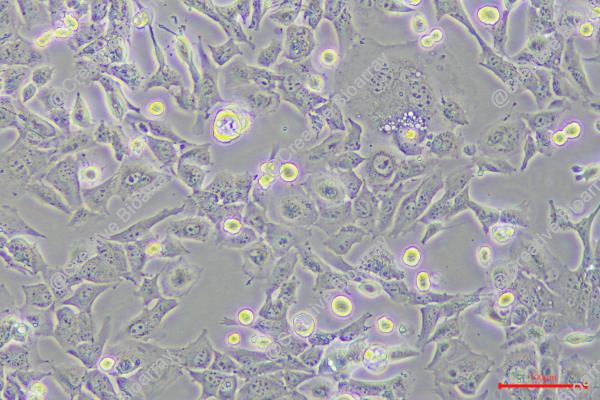
Morphology: fibroblastoid
- Specification
- Background
- Scientific Data
- Q & A
- Customer Review
The use of appropriate animal models in glioma research is essential for the development of new therapeutic approaches. An ideal animal model of human glioma should reproduce the major features of this neoplasm: predictable and reproducible in vitro and in vivo growth patterns; infiltrative, but non-metastatic tumor growth; and poor immunogenicity. Many animal brain tumor models are being used, however, no model currently available simulates human high-grade gliomas exactly. Tumor models vary in their immunogenicity, growth patterns and invasiveness. Therefore, it is important to choose an appropriate animal model depending on the endpoint examined. Most models are derived from rat, and several xenograft models based on the intracerebral transplantation of human brain tumors into immunodeficient nude mice, are also available. Murine models of malignant brain tumors are used much less frequently, mainly because the number of available models is limited.
One of the most commonly used murine brain tumor models is GL261. The GL261 tumor was induced originally by intracranial injection of 3-methylcholantrene into C57BL/6 mice and maintained by serial intracranial and subcutaneous transplantations of small tumor pieces on the syngeneic mouse strain.
The benefits of the GL261 model relate to its widespread use and extensive characterization throughout the literature. GL261 models recapitulate the histology of glioblastoma (GBM) very well. In addition, GL261 cells are easily maintained in culture, allowing them to be investigated in vitro and easily expanded for in vivo tumor injection. When grown in serum-free media, GL261 cells express CD133, a stem cell marker, and have increased tumorgenicity and immunogenicity. Therefore, GL261 cells can be used to investigate glioma stem cells, which contribute to chemo- and radioresistance in human GBM.
Implanted Luciferase-Expressing GL261 Models Prolonged Survival in C57BL/6 Mice
In order to validate controls for use in future preclinical work, we first implanted 5 × 10⁴ cells/5 μL of GL261 or GL261 Red-FLuc into the brains of C57BL/6 mice (Fig. 1a), expecting to find equivalent survival rates, as assessed by the Kaplan–Meier method. However, we found a significant difference in overall survival between these two groups (n = 20 per group, P < 0.0001). The GL261 implanted mice reached median survival at 18 days post-implantation with 100% of animals succumbing to disease after showing clear signs of clinical decline. Conversely, the GL261 Red-FLuc implanted mice did not reach median survival, and 60% of animals were described as long-term (≥ 100 days) survivors without neurological morbidity.
The significant differences found in overall survival prompted us to investigate if tumor dose or the type of luciferase expressed affect results found. We therefore evaluated an escalating tumor dose (Fig. 1b) of 3 × 10⁵ cells/5 μL of luciferase-expressing GL261 Red-FLuc or GL261-Luc2 cells against our starting dose of 5 × 10⁴ cells/5 μL. In this subsequent experiment, we found that mice implanted with 5 × 10⁴ cells of GL261 reached median survival at 21 days with 100% tumor penetrance (n = 20), similar to previous experiments. For GL261-Luc2 cells, the higher tumor dose of 3 × 10⁵ GL261-Luc2 cells (n = 10) approached the median survival of the GL261 mice dosed with 5 × 10⁴ cells, and 100% symptomatic tumor penetrance. However, mice implanted with 5 × 10⁴ GL261-Luc2 cells (n = 10) demonstrated a significantly prolonged median survival of 37 days in comparison to GL261 implanted mice (P = 0.0011). Of note, 40% of animals implanted with 5 × 10⁴ GL261-Luc2 cells reached long term survival (> 100 days), without symptomatic tumor burden. In contrast, the mice implanted with either dose of GL261 Red-FLuc cells did not reach median survival, regardless of dose. Specifically, 60% of those implanted with 5 × 10⁴ cells (n = 10) achieved long-term survival and 70% of those intracranially injected with a tumor dose of 3 × 10⁵ cells (n = 20) were termed long-term survivors.
GL261 and GL261 Luciferase-Expressing Cells Have Similar Proliferation Rates In Vitro
To explain the underlying differences found in overall survival, we next examined these cells for differences in cell growth and proliferation. First, we assessed in vitro proliferation of both cell lines via spectrophotometric CCK-8 assay and cell counting 48 h after seeding cells. We observed no differences for in vitro proliferation between the cell lines GL261 (3.503 ± 0.178, n = 6), GL261 Red-FLuc (3.395 ± 0.106, n = 6) and GL261-Luc2 (3.57 ± 0.144, n = 6) (Fig. 1c). In addition, we verified luciferase reporter gene and protein expression by ONE-Glo EX Luciferase Assay System (Fig. 1d). Here, we demonstrate that the original GL261 cells do not express luciferase, whereas the GL261 Red-FLuc and GL261-Luc2 cells are strongly positive for luciferase expression at (2.48 ± 0.08)105 RLU (relative light unit) (n = 6) and (1.29 ± 0.2)106 RLU (n = 6), respectively (P < 0.0001).
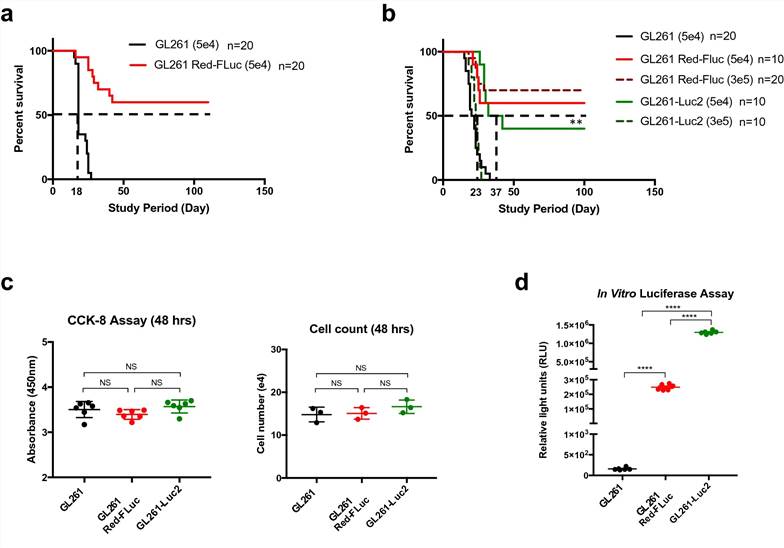 Fig. 1. Outcomes for C57BL/6 mice intracranially injected with glioma cells. (a) Kaplan–Meier survival analysis showing median survival for GL261 and GL261 Red-FLuc implanted mice. (b) Displays median survival at increasing tumor doses. (c) Measurements of proliferation rate for all three cell lines. (d) Luciferase expression verified reporter gene expression in GL261 Red-FLuc and GL261-Luc2 cells. (Sanchez, Victoria E., et al., 2020)
GL261-Red Luciferase-Expressing Tumors Recruit More Pro-inflammatory Cells to the Brain Microenvironment
Flow cytometry experiments were used to analyze the immune cell frequency in dissociated brain tissue cell suspensions from mice injected with 5 × 10⁴ cells/5 μL of GL261 or GL261 Red-FLuc tumor cell lines sacrificed 10 days following tumor implantation (n = 5 per group) (Fig. 2a). Day 10 was chosen to capture the immune infiltration into the GL261 tumors before growth caused significant morbidity but before luciferase-expressing tumors regressed.
First, we compared the frequency of phenotypically sub-gated T-cells of mice injected with either GL261 or GL261 Red-FLuc (Fig. 2b). We observed a significant increase in the frequency of CD4+T cells of the GL261-injected mice (mean 0.8896%) compared to that of the GL261 Red-FLuc injected mice (mean 2.731%). Conversely, there was a significant decrease in CD4+Tregs (from mean 45.28% to 16.82%) in GL261 compared to the GL261 Red-FLuc. The CD8+T-cell population frequency showed a significant increase in the GL261 Red-FLuc (mean 1.478%) compared to GL261 (mean 0.324%). There was an increase in the frequency of CD8+Tregs in the GL261 group that did not reach significance (p = 0.08). When comparing macrophage populations, there was a significant increase in activated macrophages (F4/80+CD11b+cells) in GL261 Red-FLuc (mean 15.33%) compared to GL261 (mean 5.6%) tumors.
We repeated this flow cytometry analysis on mice injected with 5 × 10⁴ cells/5 μL of GL261 or GL261-Luc2 to compare immune cell frequencies between these two tumor cell lines (Fig. 2c). There was a slight observed increase in activated macrophages, however, there were no significant differences observed between brains of mice implanted with these two cell lines.
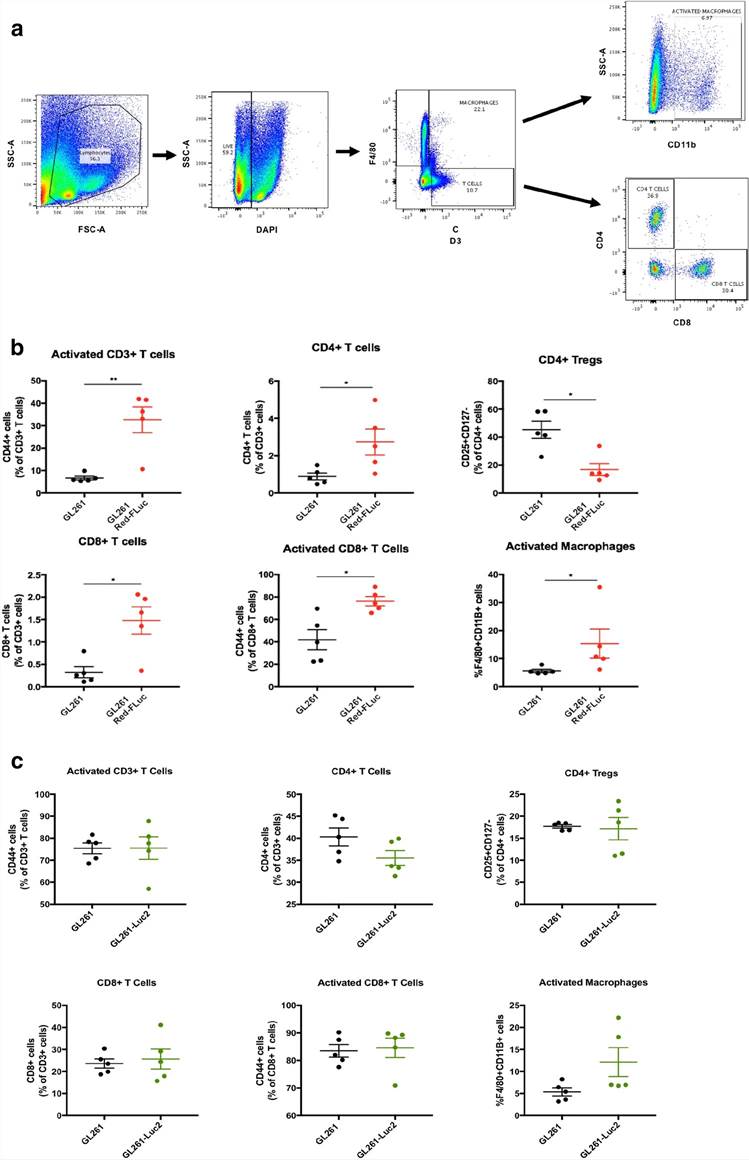 Fig. 2. (a) Displays the various cell populations gated for F4/80+ macrophages and CD3+ T cells. CD3+ T-cell subsets were then fractioned by CD4 and CD8 positivity. (b) Shows the frequencies of immune cells observed in the GL261 and GL261 Red-FLuc implanted brains dissociated into a single cell suspension 10 days post-implantation. (c) Displays a panel of immune cell frequencies observed in GL261 and GL261-Luc2 implanted brains (Sanchez, Victoria E., et al., 2020).
Ask a Question
Write your own review
- You May Also Need

